Standardize Projects with Templates for SharePoint
BrightWork templates for SharePoint are suited to every type of project, team, and industry.
Trusted by industry leaders
Leverage SharePoint On-Premises
Enable project management in SharePoint.
Start Quickly
Built-in Templates
Collaborate Together
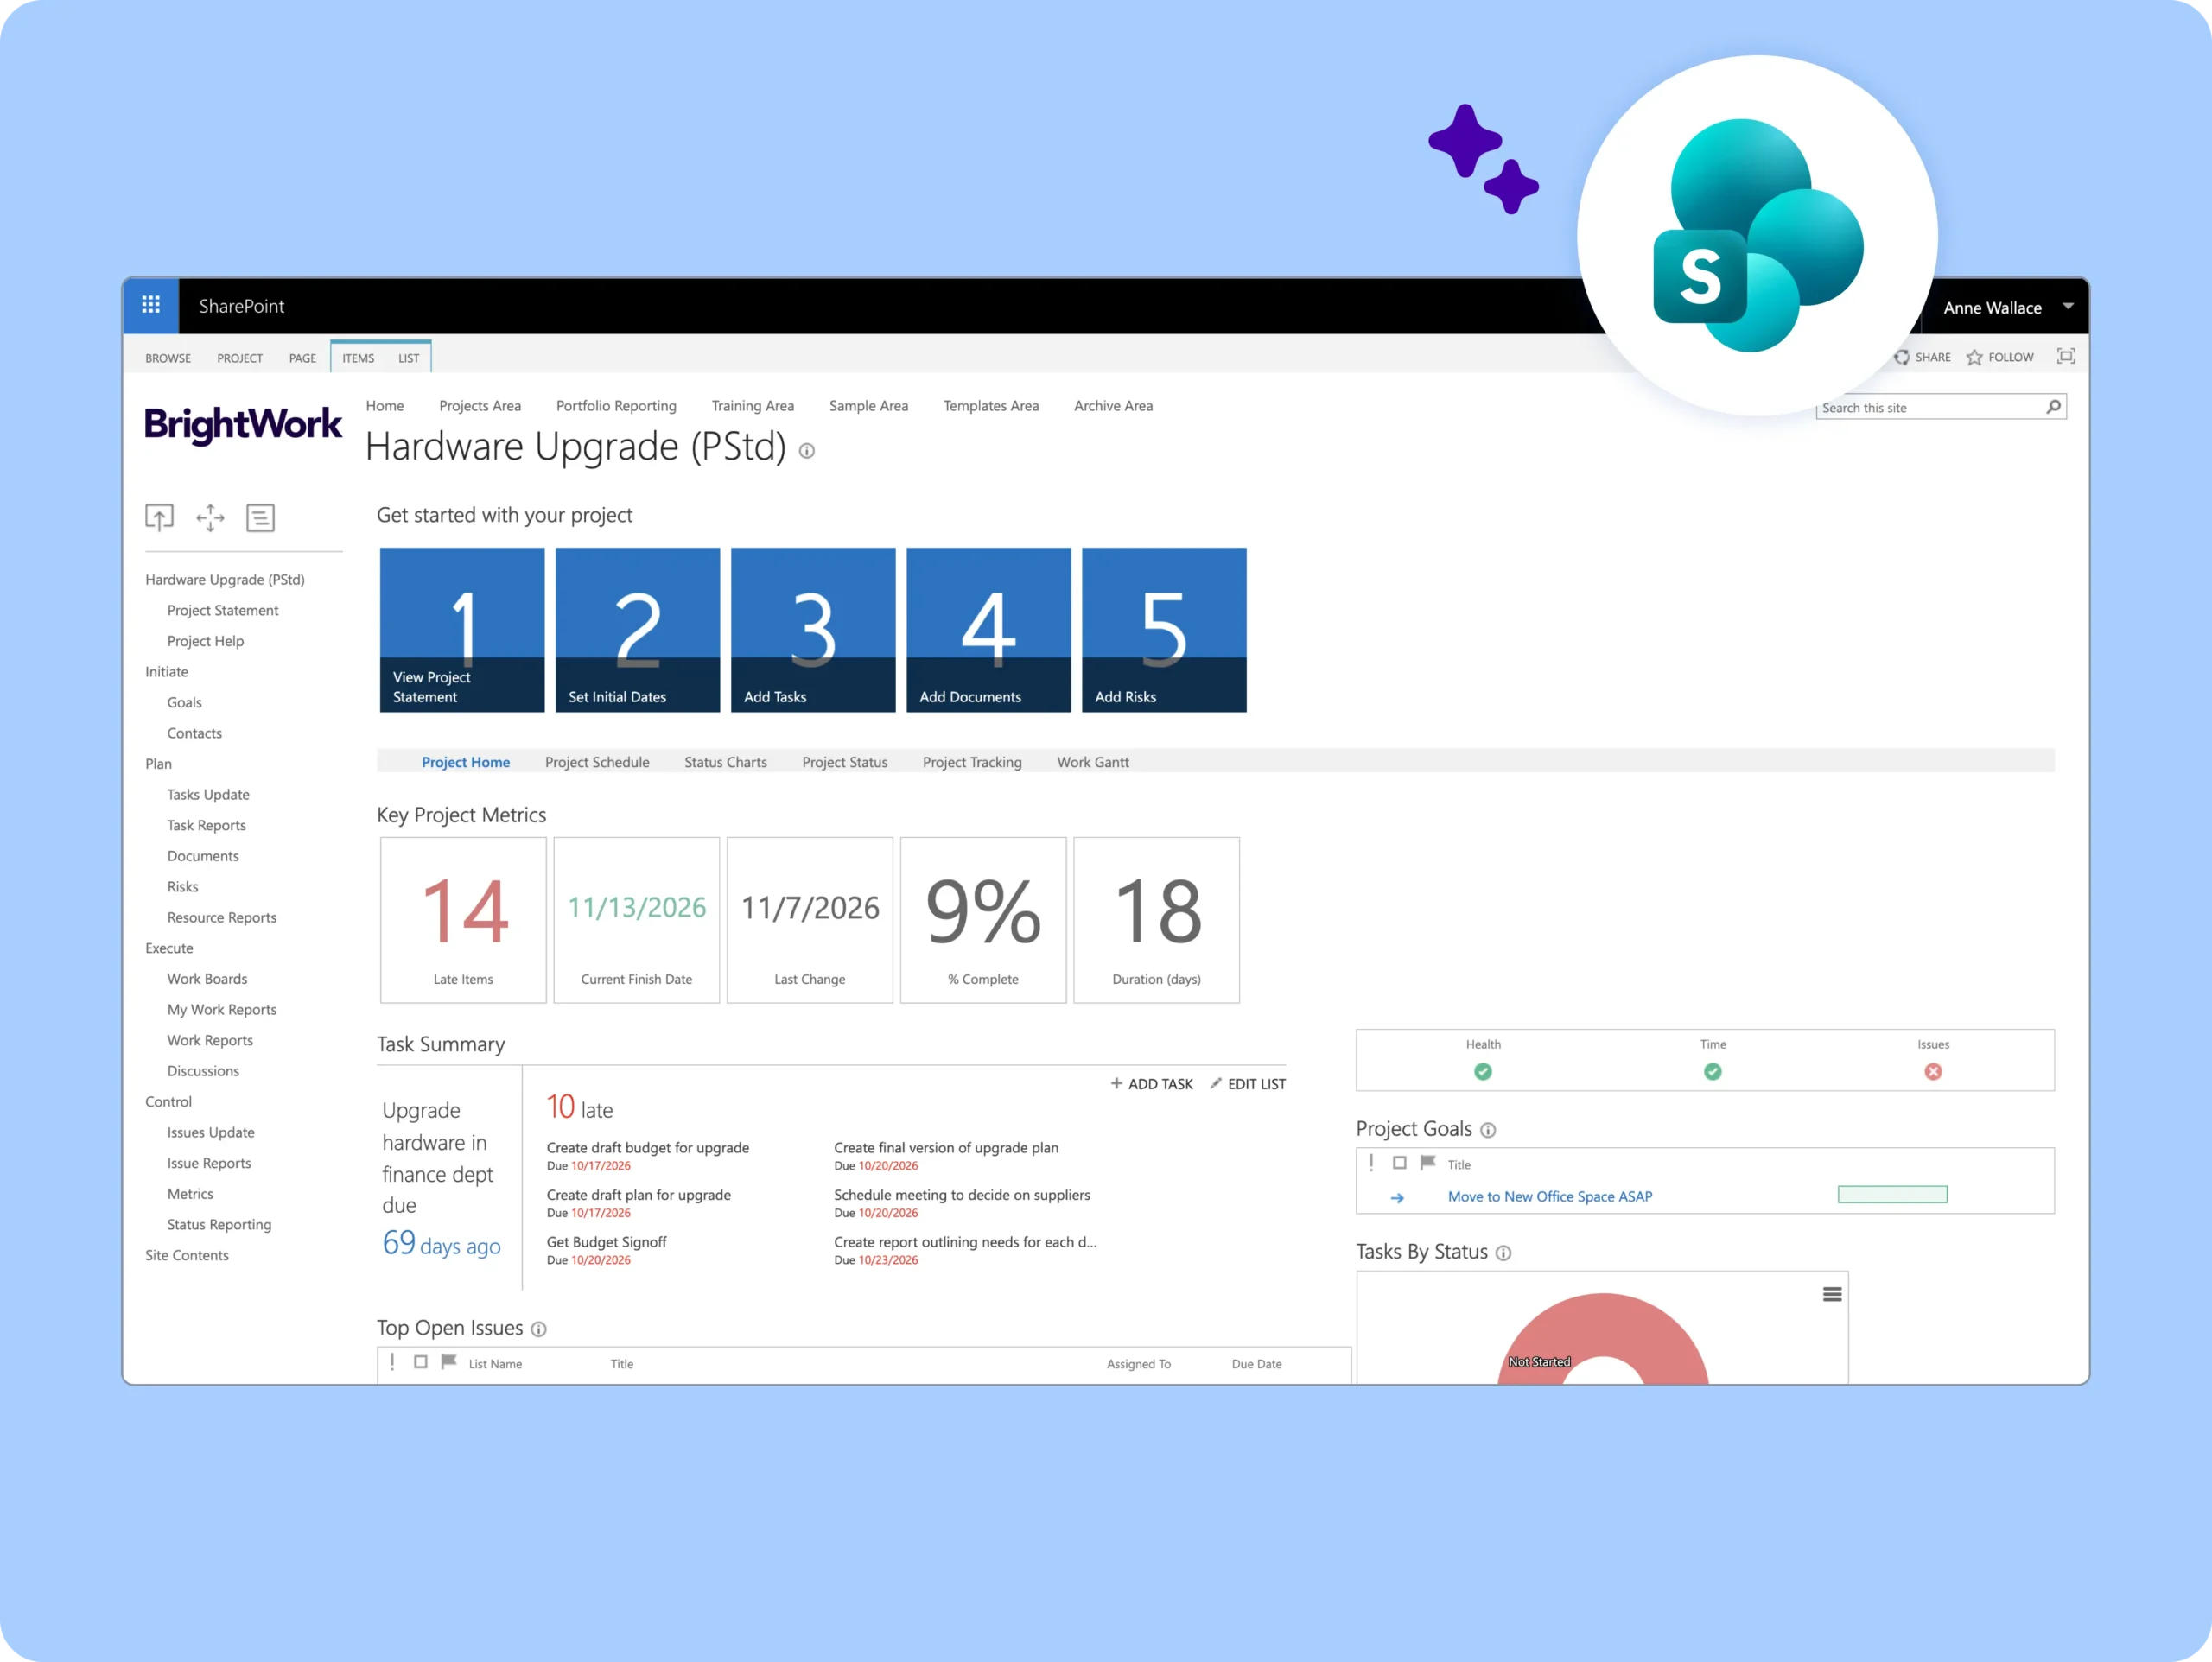
Project Management Templates for SharePoint
Manage tasks, report on progress, and increase collaboration in one tool.
Portfolio Management Templates for SharePoint
Manage tasks, report on progress, and increase collaboration in one tool.
Manage Projects
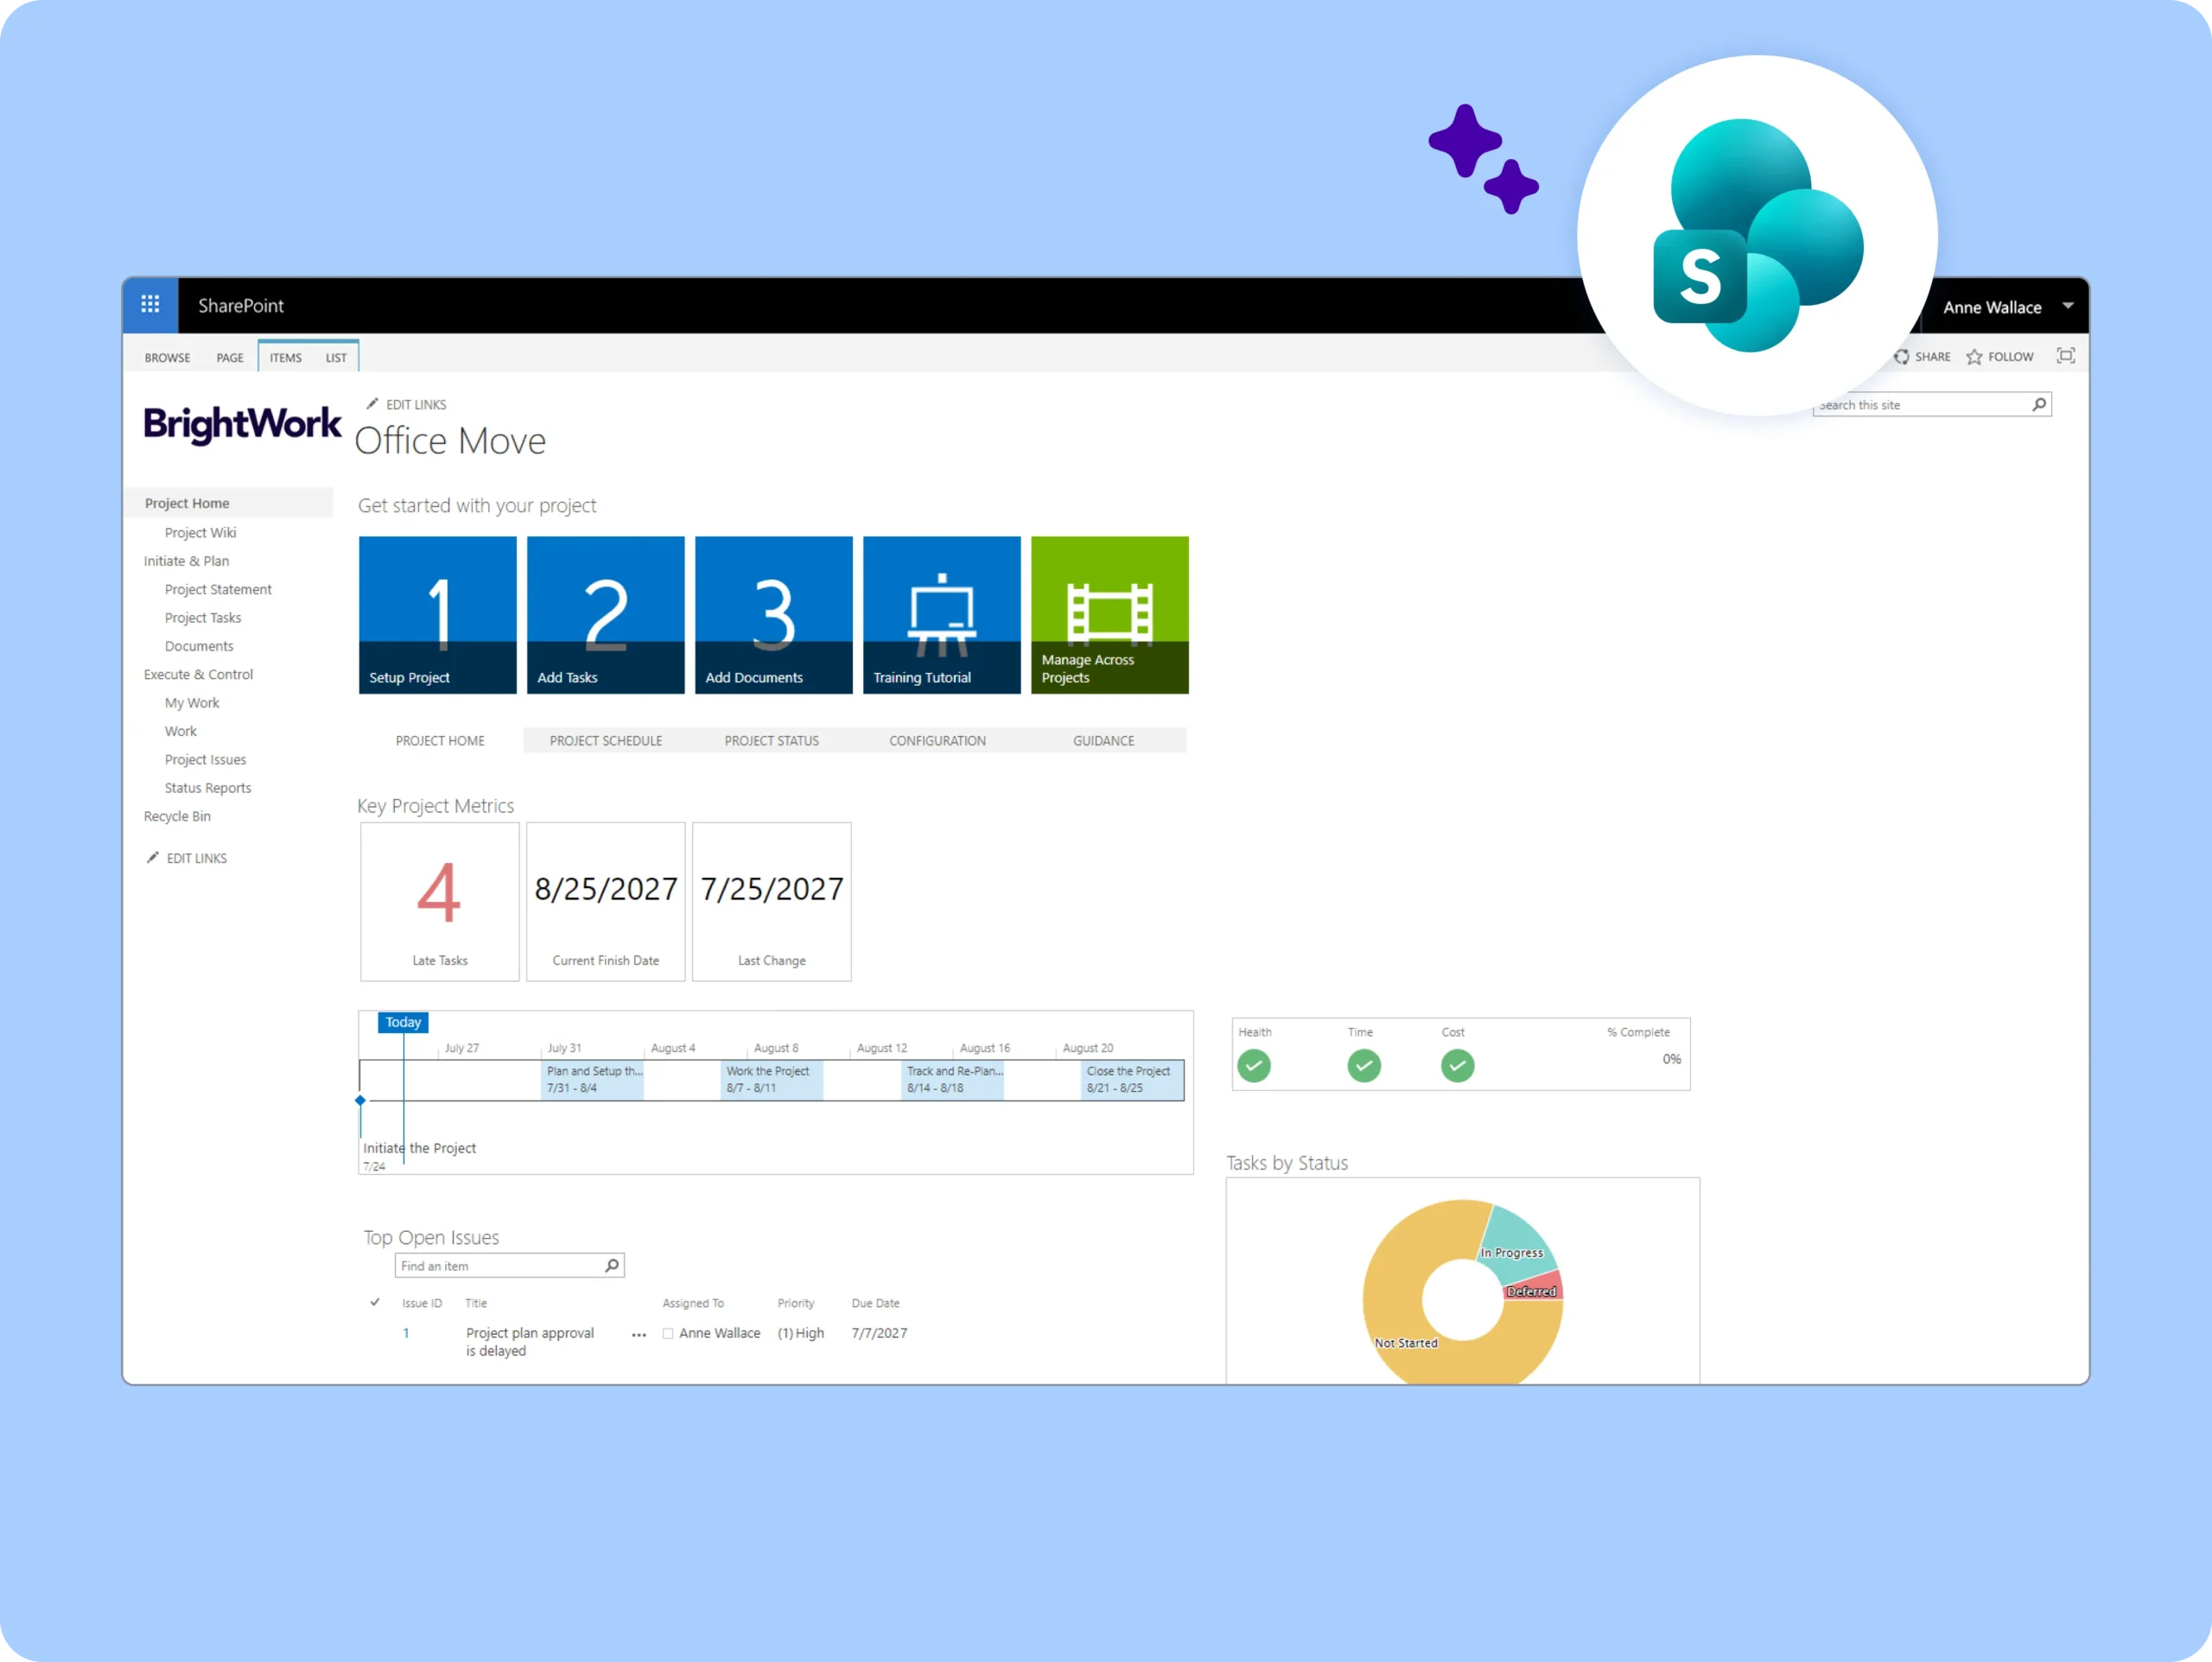
BrightWork SharePoint Project Management Solution: Work Together From Anywhere
-
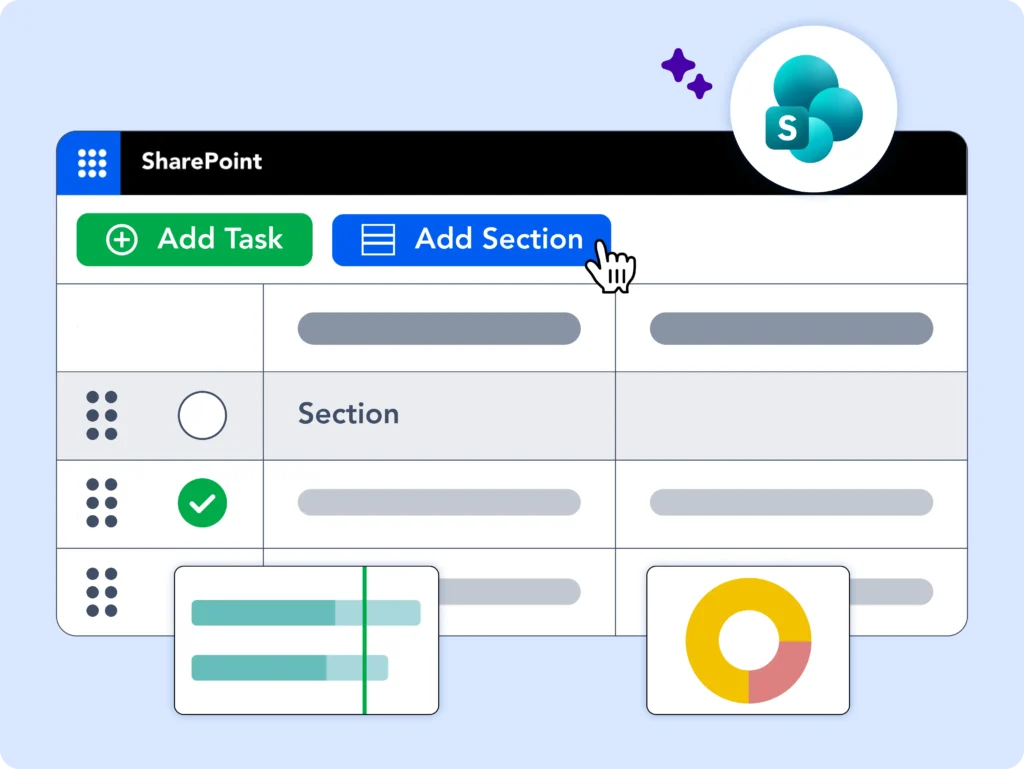
Hit the ground running with Standardized project management templates
-
Simplify task management with Agile Boards and Work Reports.
-
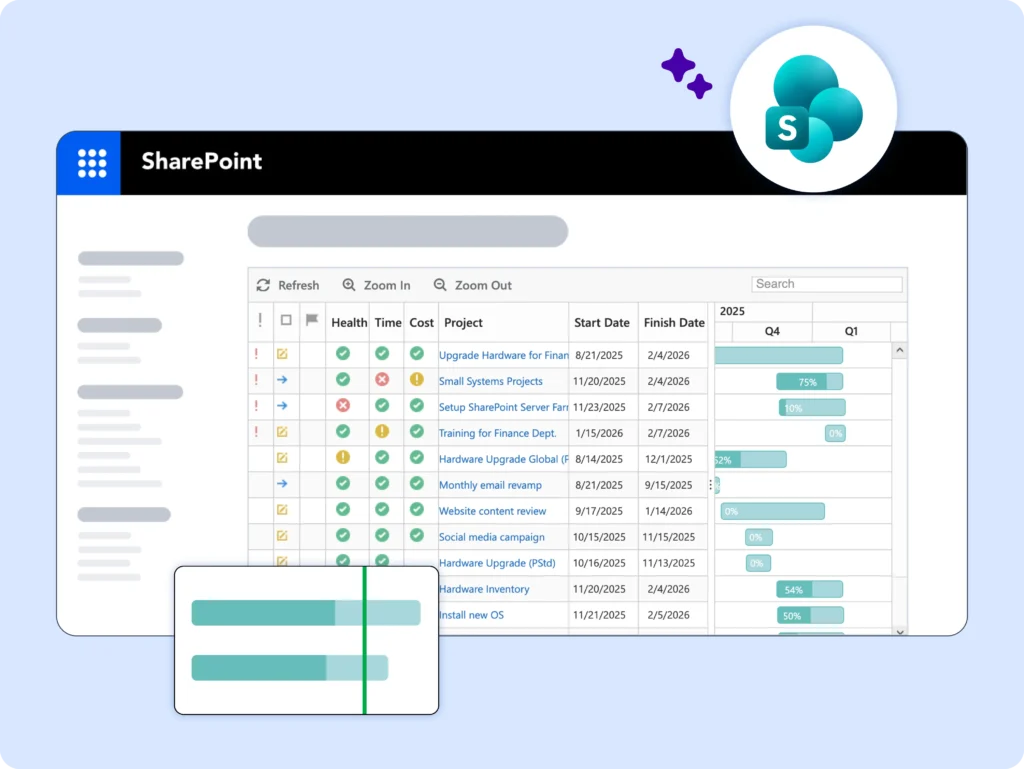
Manage deadlines with interactive Gantt charts and simple yet powerful scheduling.
-
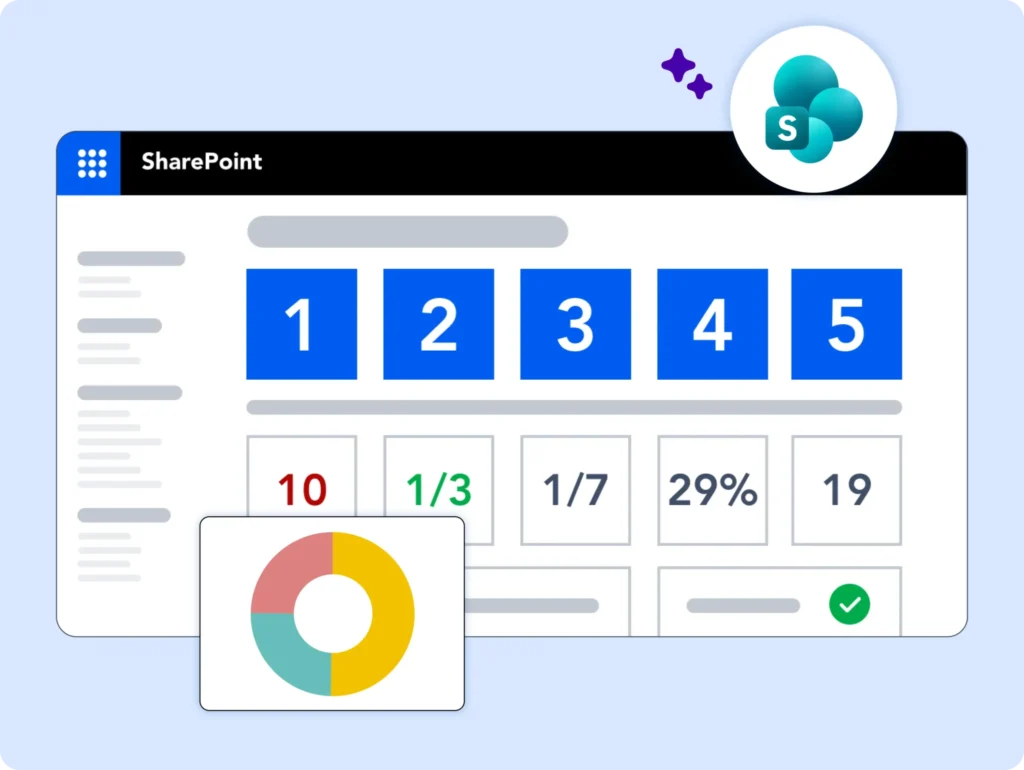
Share Progress With Automated Project Reporting.
-
Understand progress with status reports, KPIs, and dashboards.
-
Easily track and re-plan tasks to move work forward.
-
Quickly engage stakeholders with automated email sharing.
-
Collaborate With a Team Focused Project Site.
-
Make it easy for your team to find, do, and update work.
-
Collaborate on documents and deliverables in one secure place.
-
Use automated reminders to keep the team focused on the big picture.
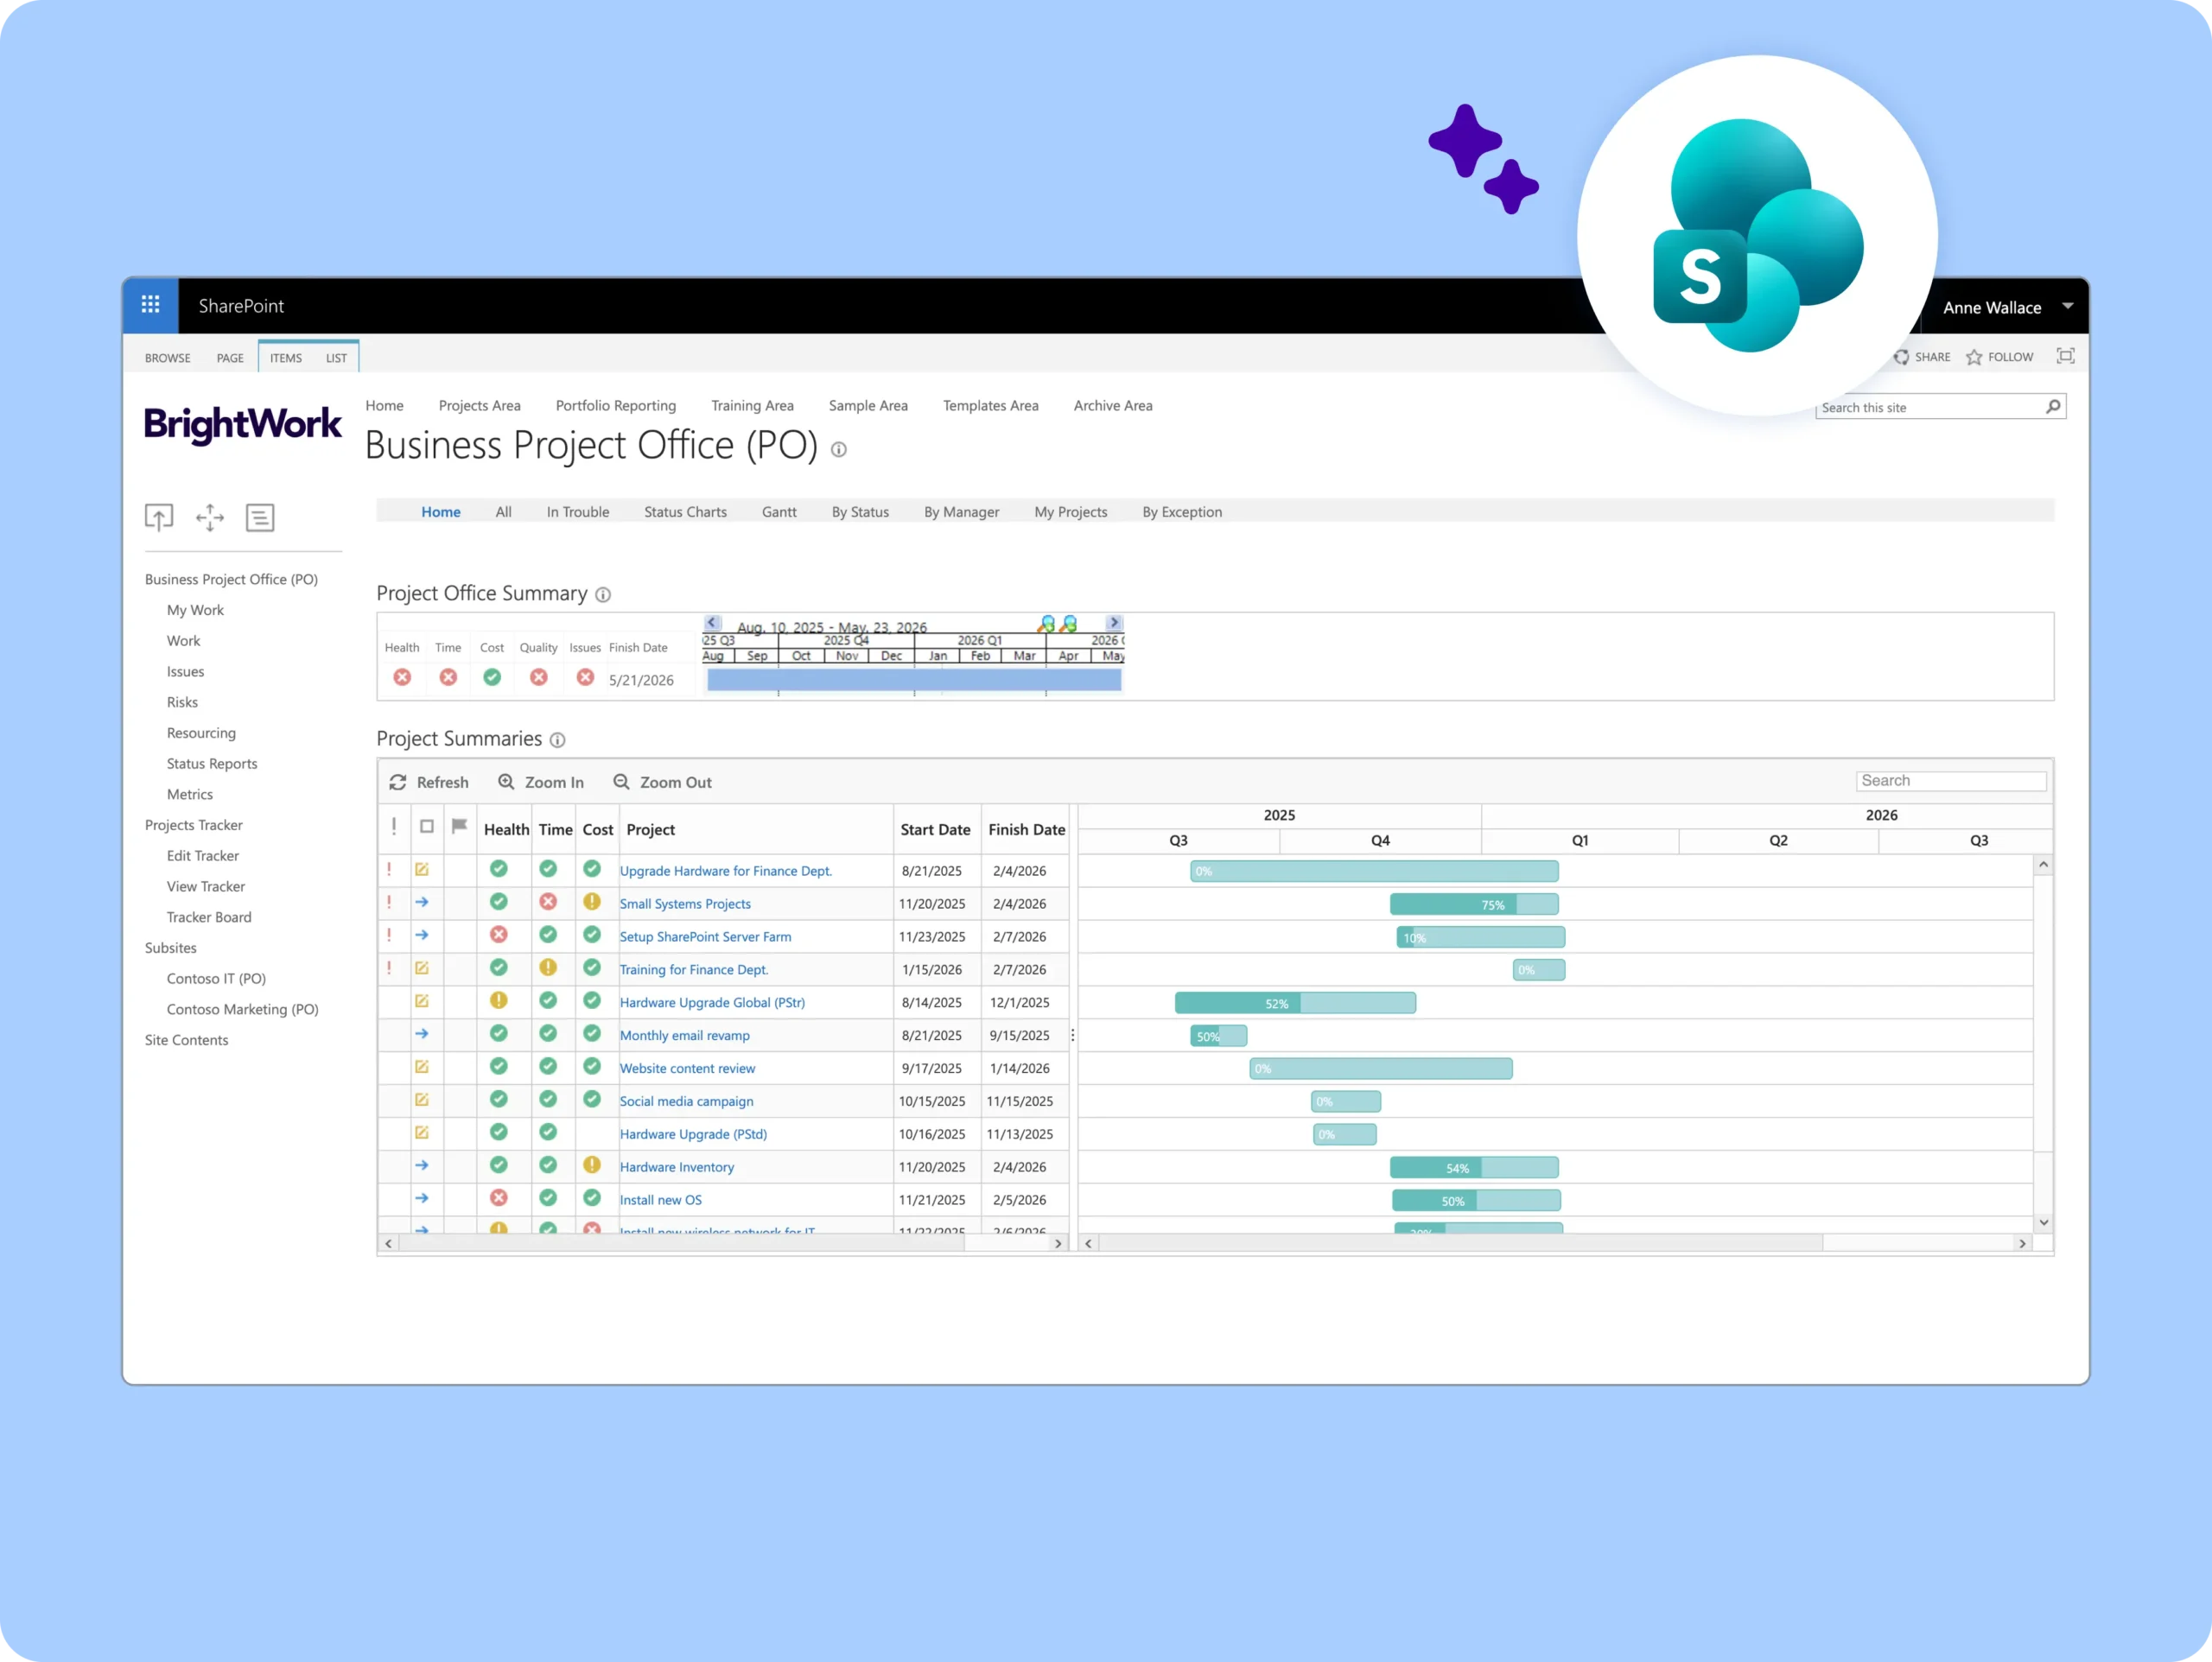
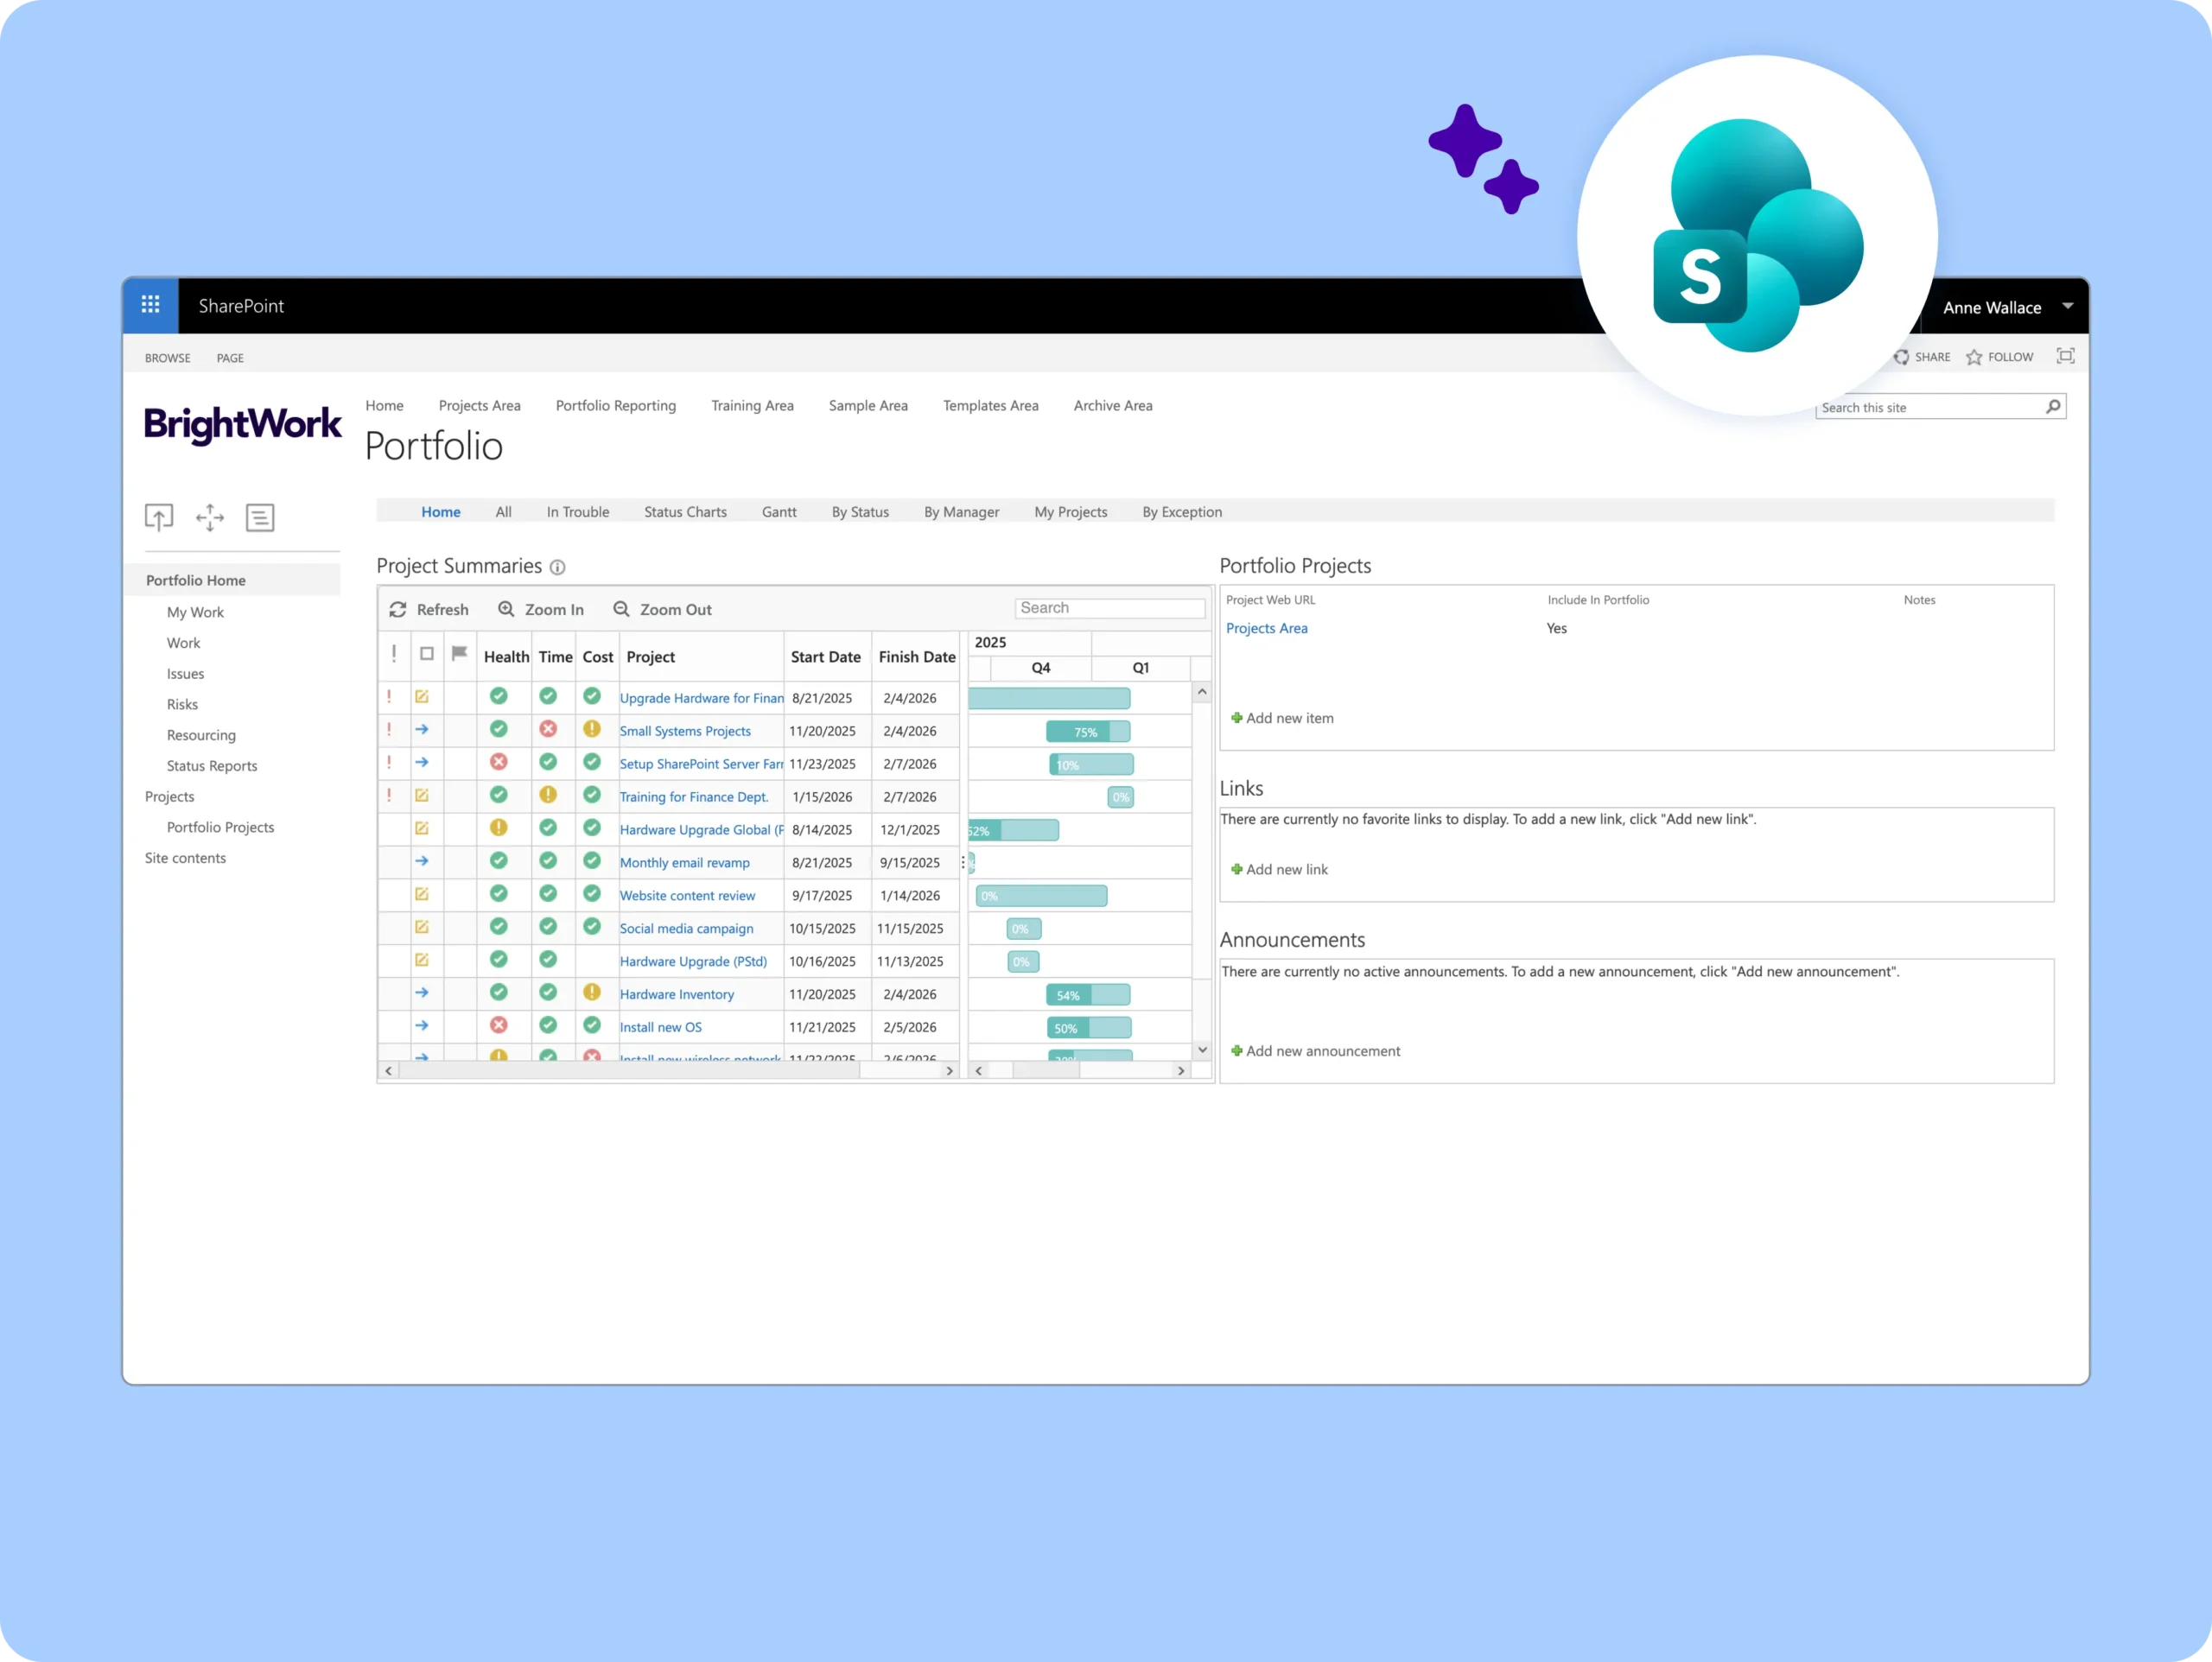
Control Portfolios
Deliver initiatives with confidence.
-
Report across projects with a Project Office Template and custom dashboards.
-
Understand the details with drill-down reports.
-
Use Microsoft Power BI dashboards to drive project decisions.
-
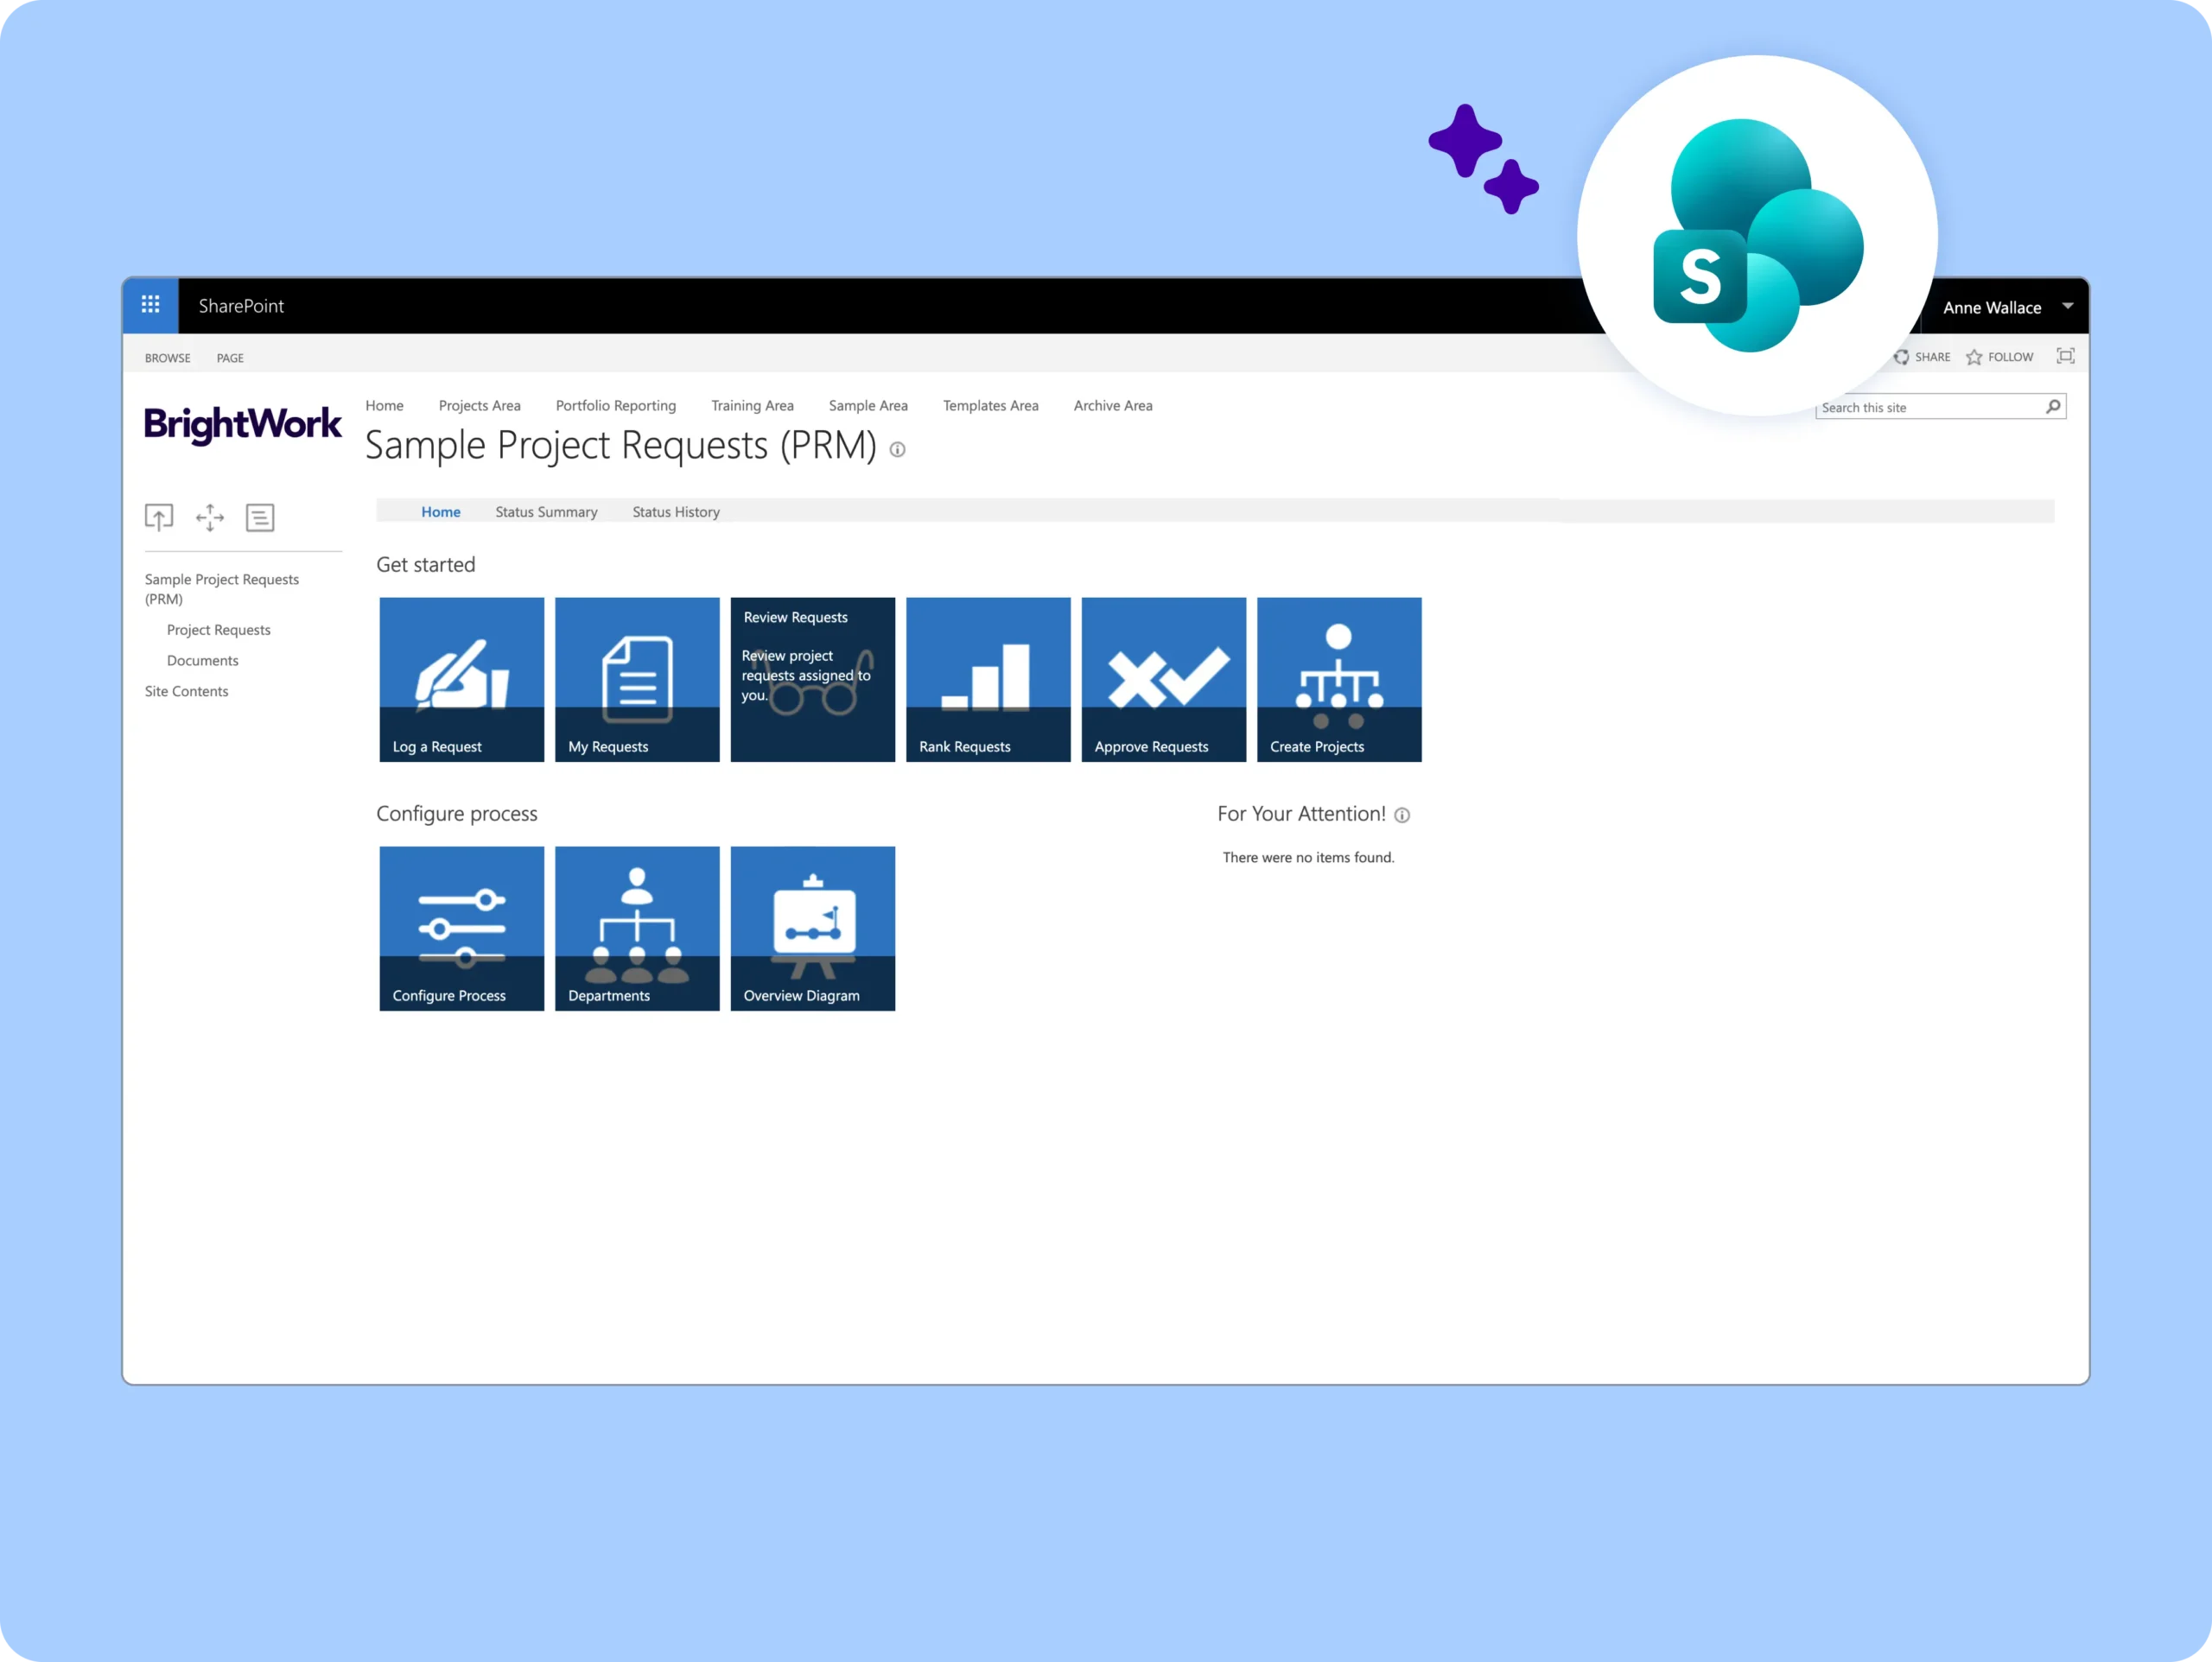
Move from idea to execution with a Project Request Managementtemplate.
-
Understand resource requirements for proposed projects.
-
Create project sites based on approved requests.
-
Assign the right people to the right project at the right time.
-
Avoid bottlenecks with work distribution reports.
-
Track non-people resources.
BrightWork Deployment Approach
Leverage our proven approach Start-Evolve to design your project management journey.
Start
Evolve
Keep Evolving
Customer Success Stories


Looking for templates on Microsoft 365?
BrightWork 365 lets you plan, manage, and collaborate in Microsoft 365.