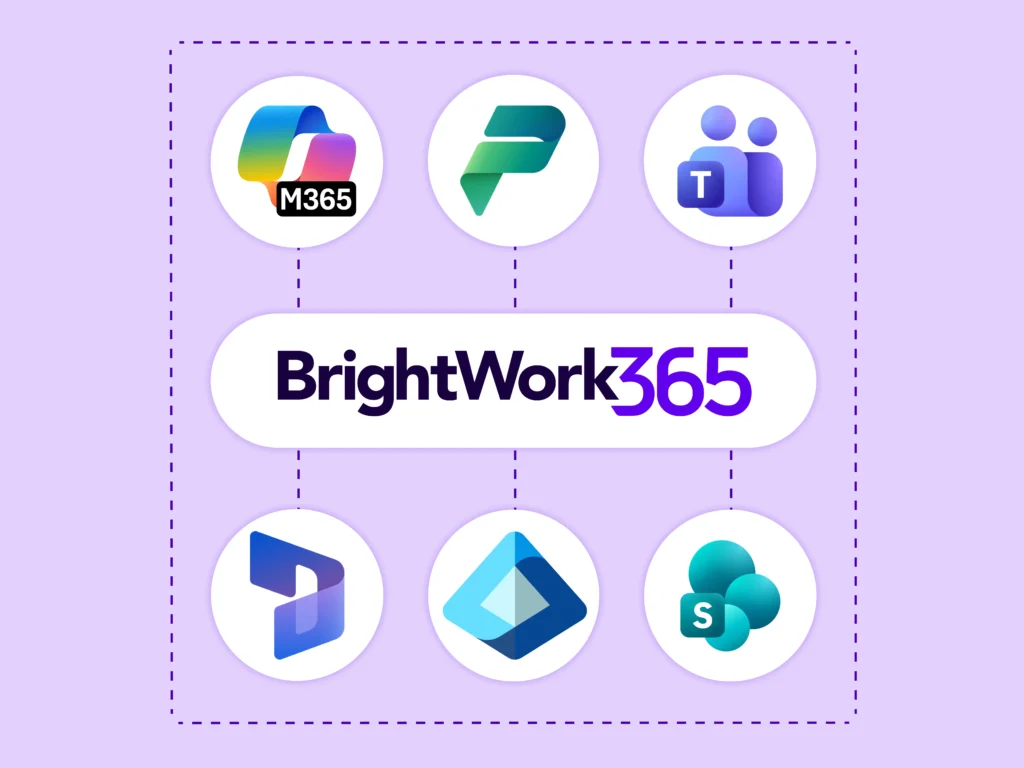
BrightWork 365 and Microsoft Power BI
Get complete visibility across all projects in one place – track progress, spot bottlenecks, and make smarter decisions.
Trusted by industry leaders
Do More with project Data
-
Project teams are generating more data than ever.
-
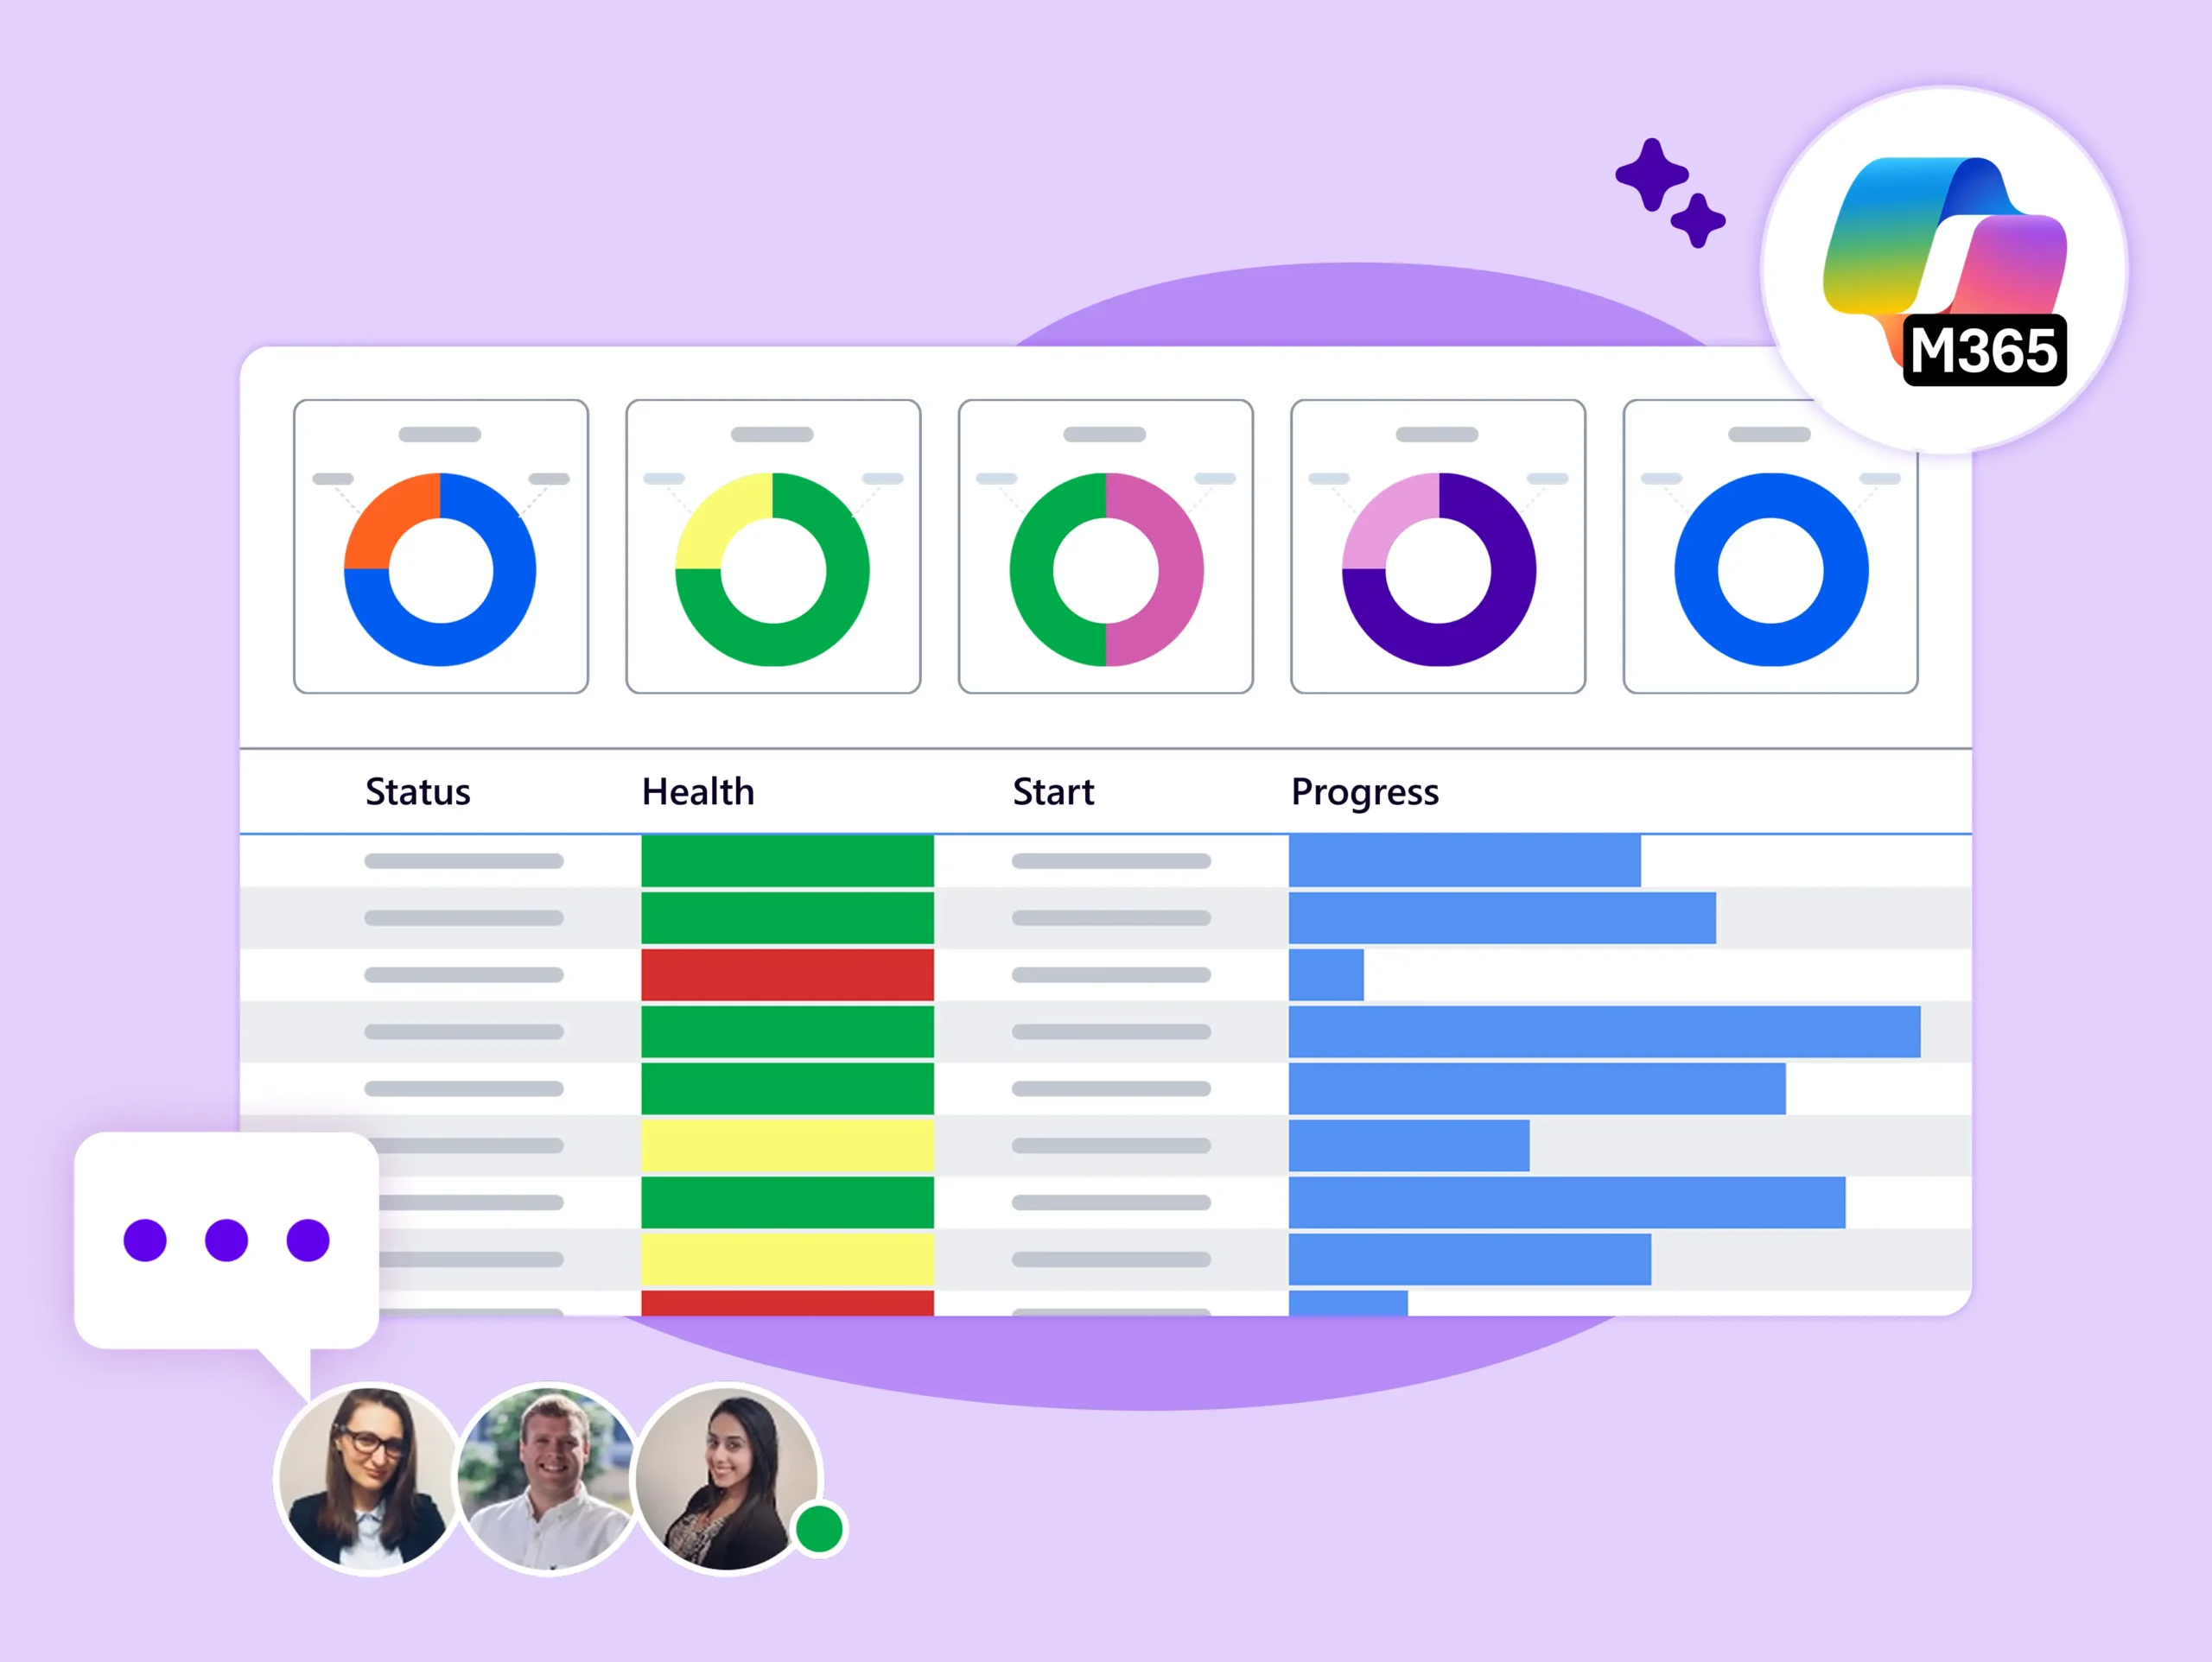
Using Power BI dashboards and reports, BrightWork 365 helps senior executives and PMO leads to easily access, analyze, and action this data.
Explore Key Features
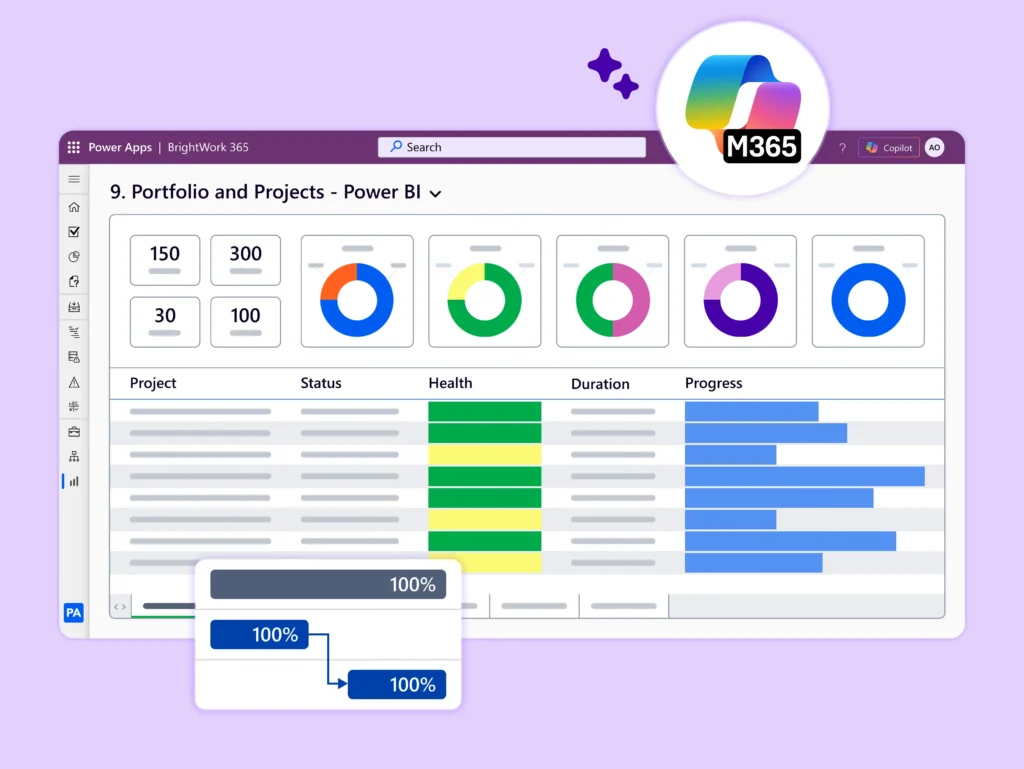
Get actionable insights with Power BI and BrightWork 365.
-
Track all projects in one dashboard with status, health, issues, and overdue tasks.
-
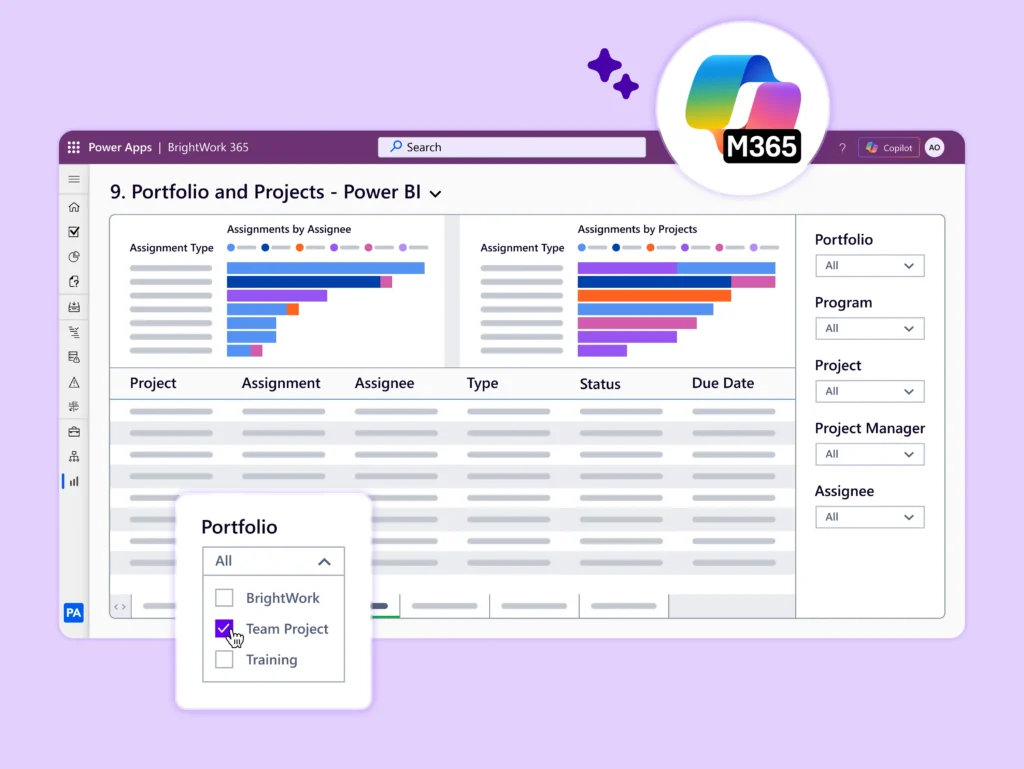
Customize the data with filters for portfolio, program, project, or project manager.
-
Drill down into individual project sites for further information.
-
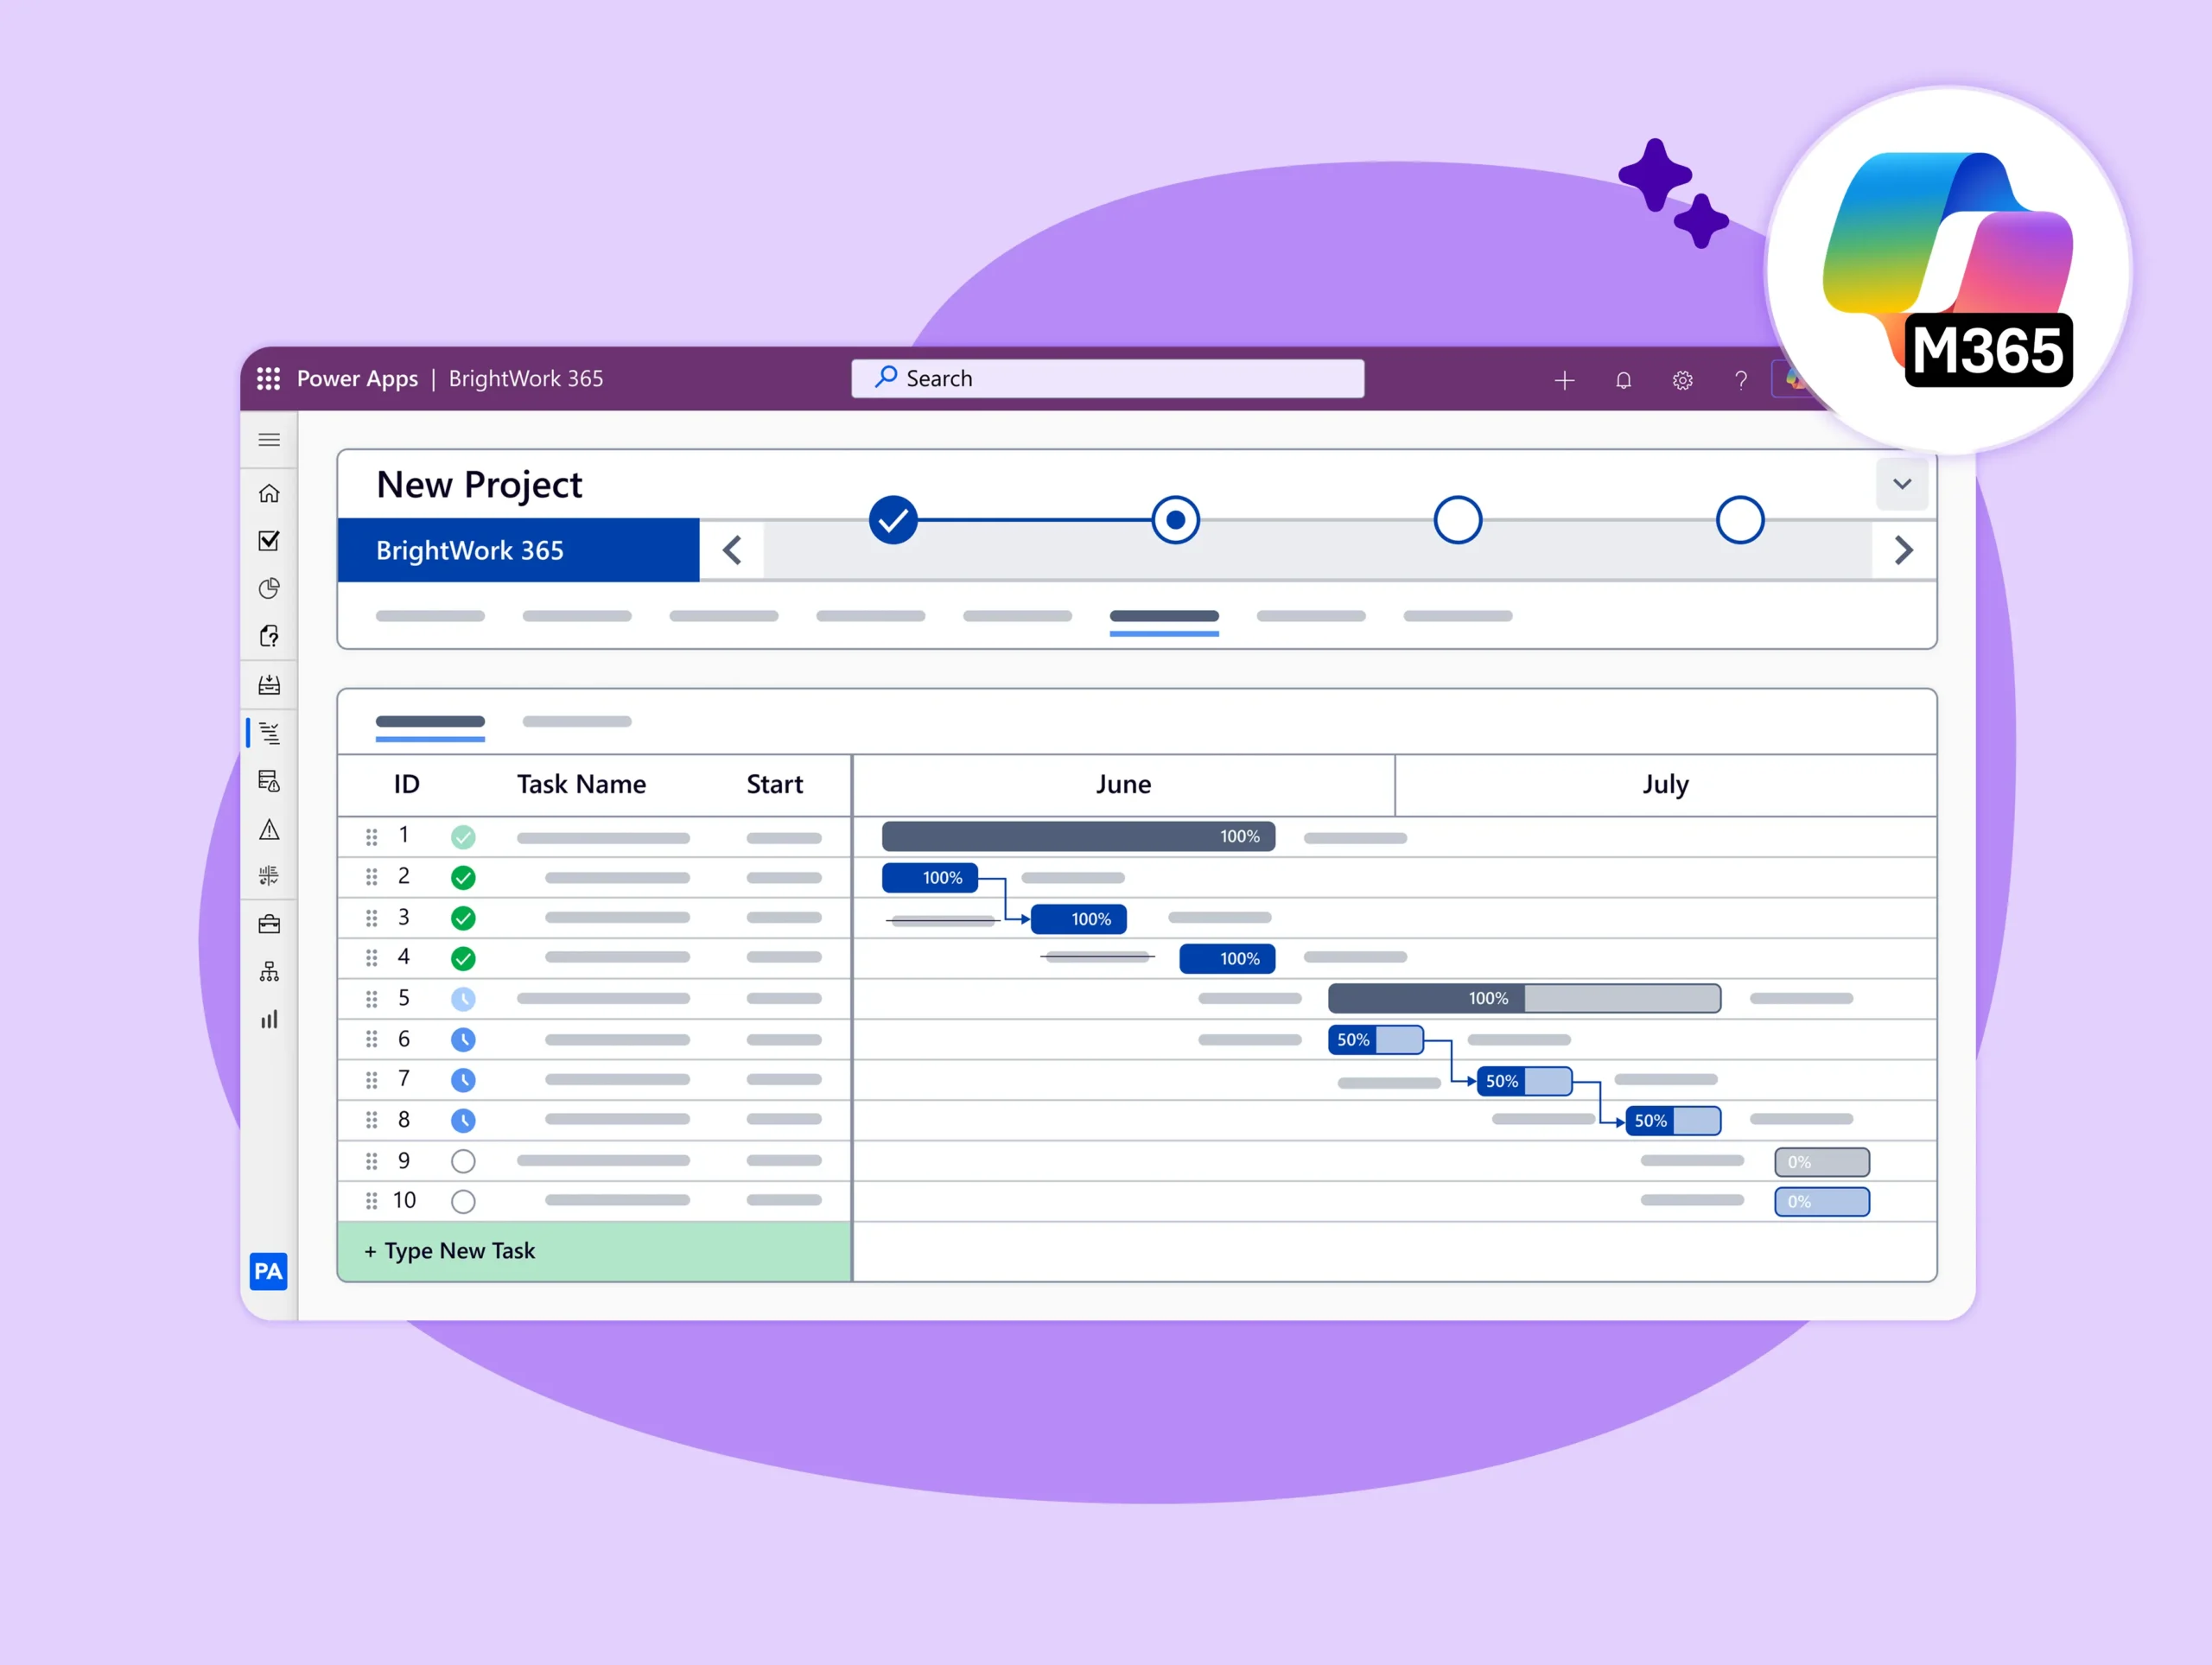
Track the schedules for all projects with an interactive Gantt chart.
-
Easily understand the current start and finish date and the status (underway, late, or overdue) of your projects.
-
Focus on what you need to see with filters for portfolio, program, project, or project manager.
-
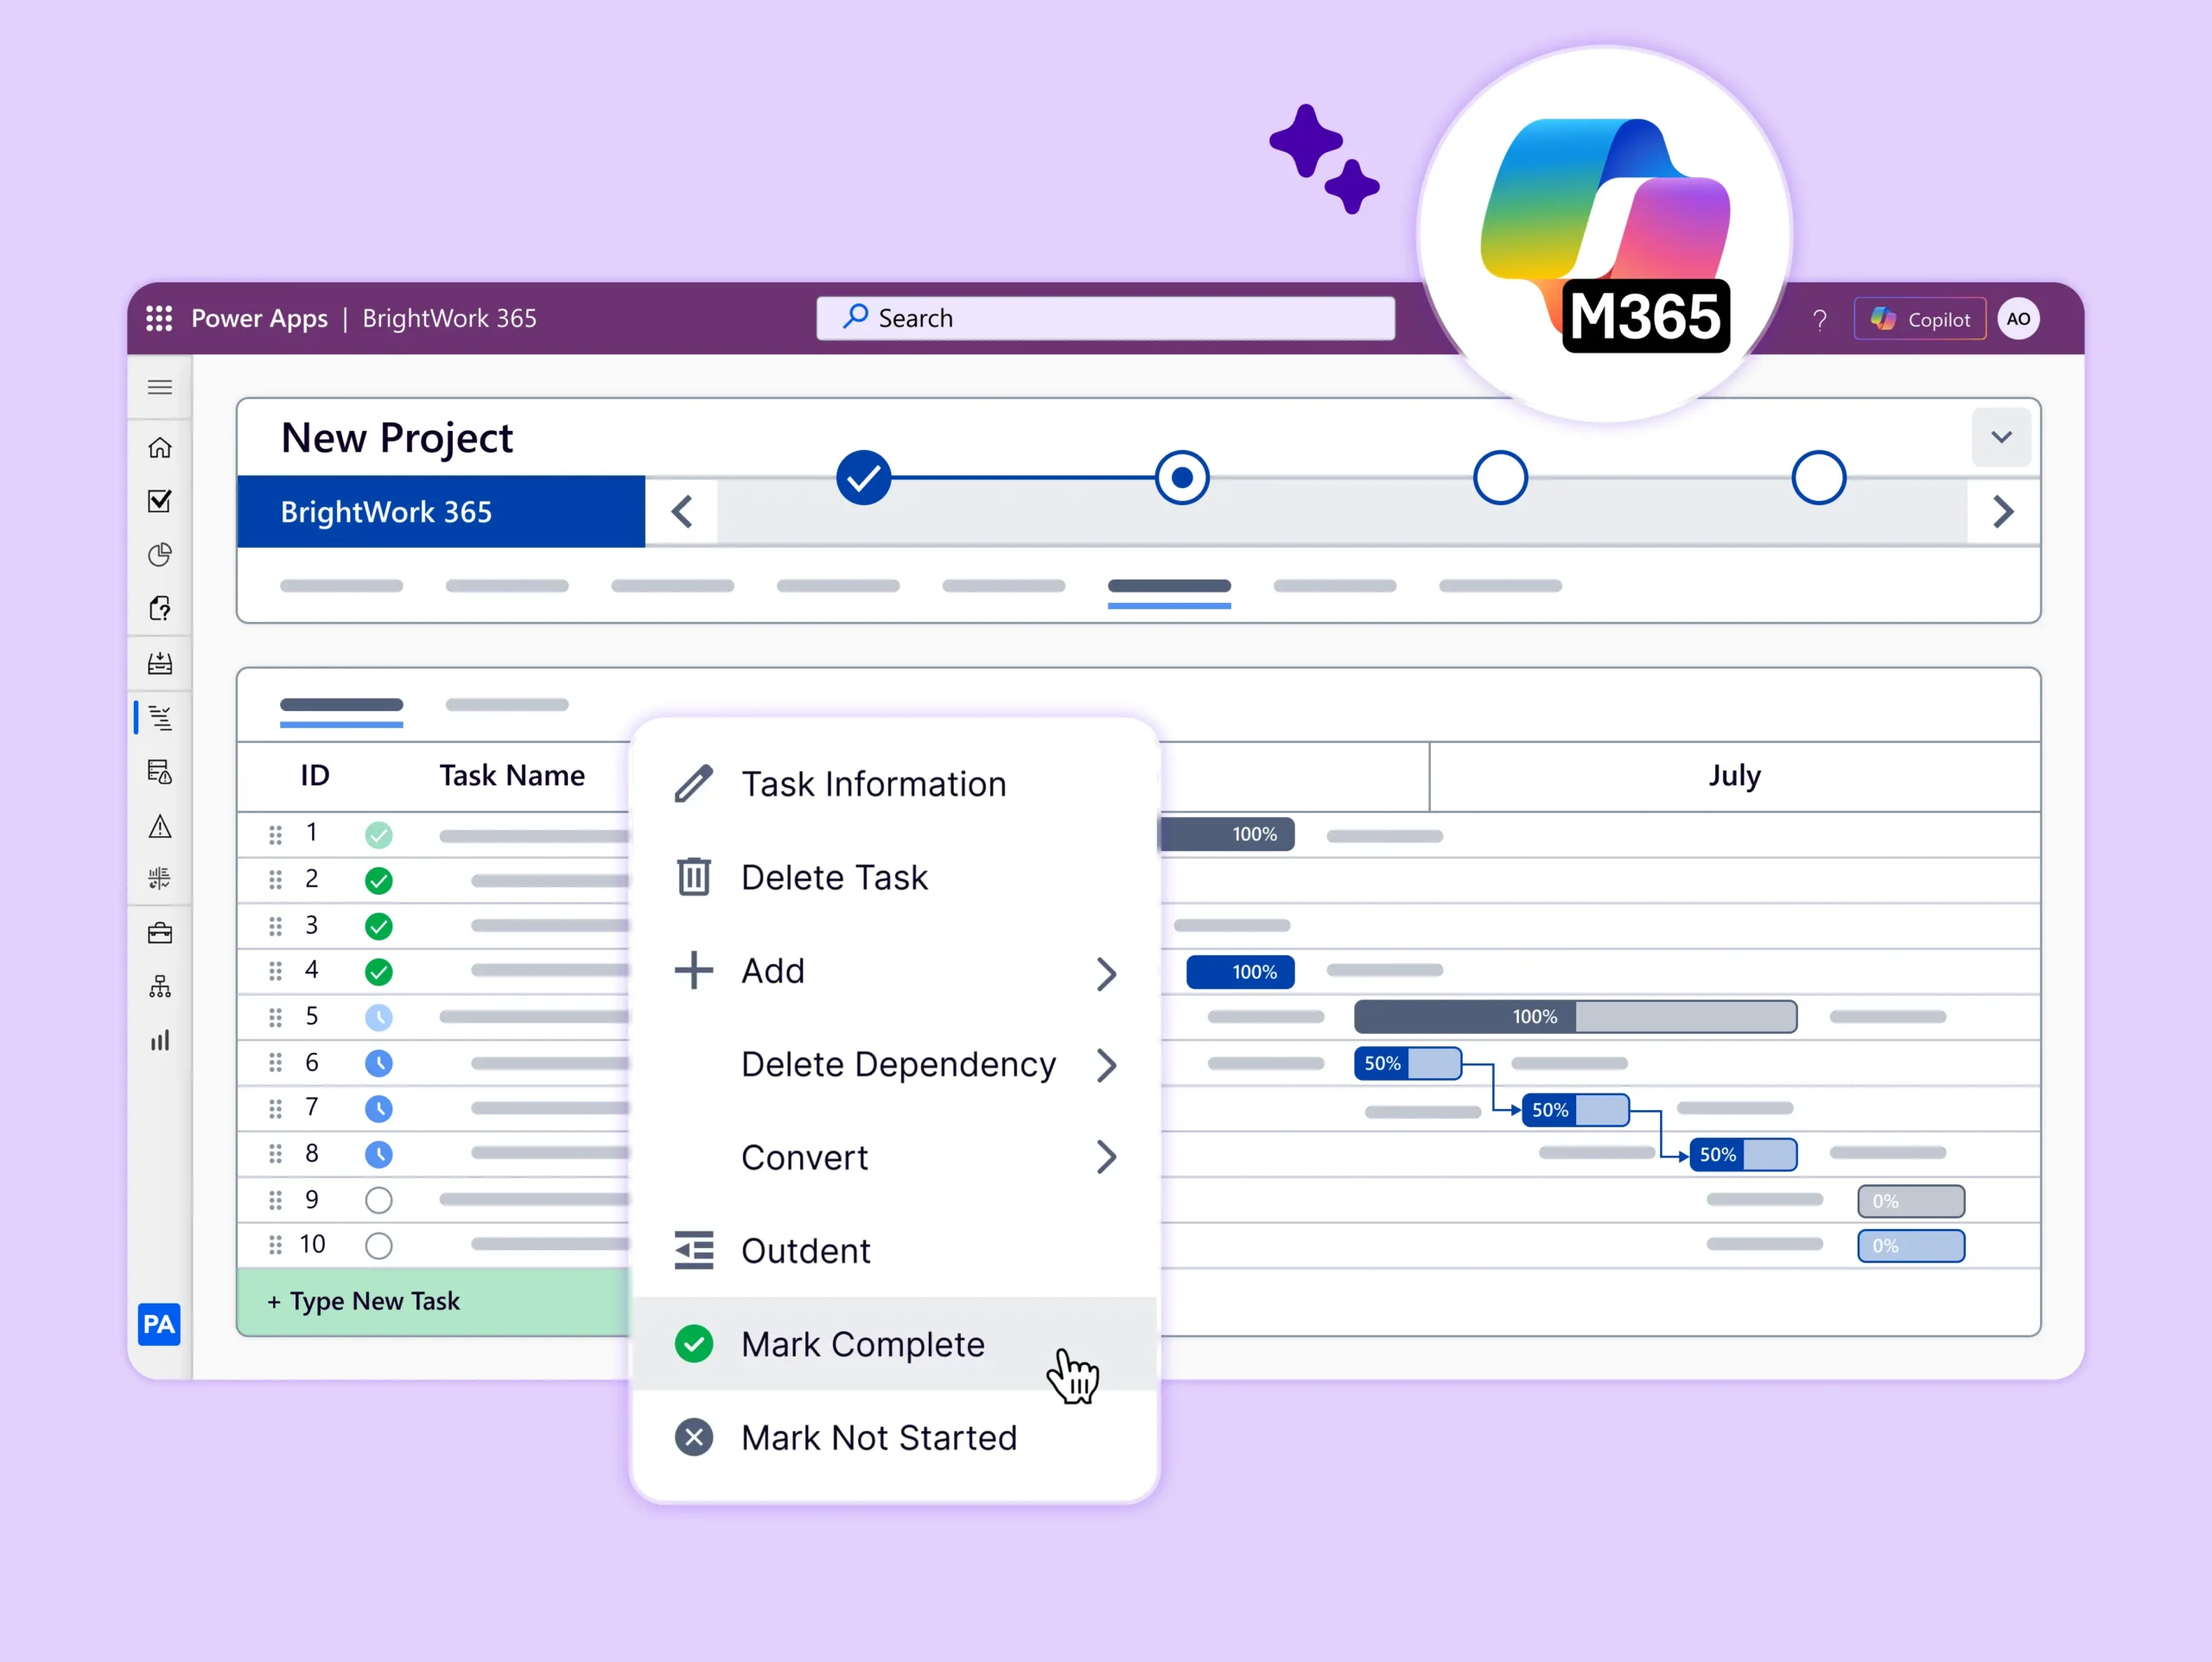
Get more insight into tasks per project using an interactive Gantt chart.
-
See the current start and finish date and the status (underway, late, or overdue) of work.
-
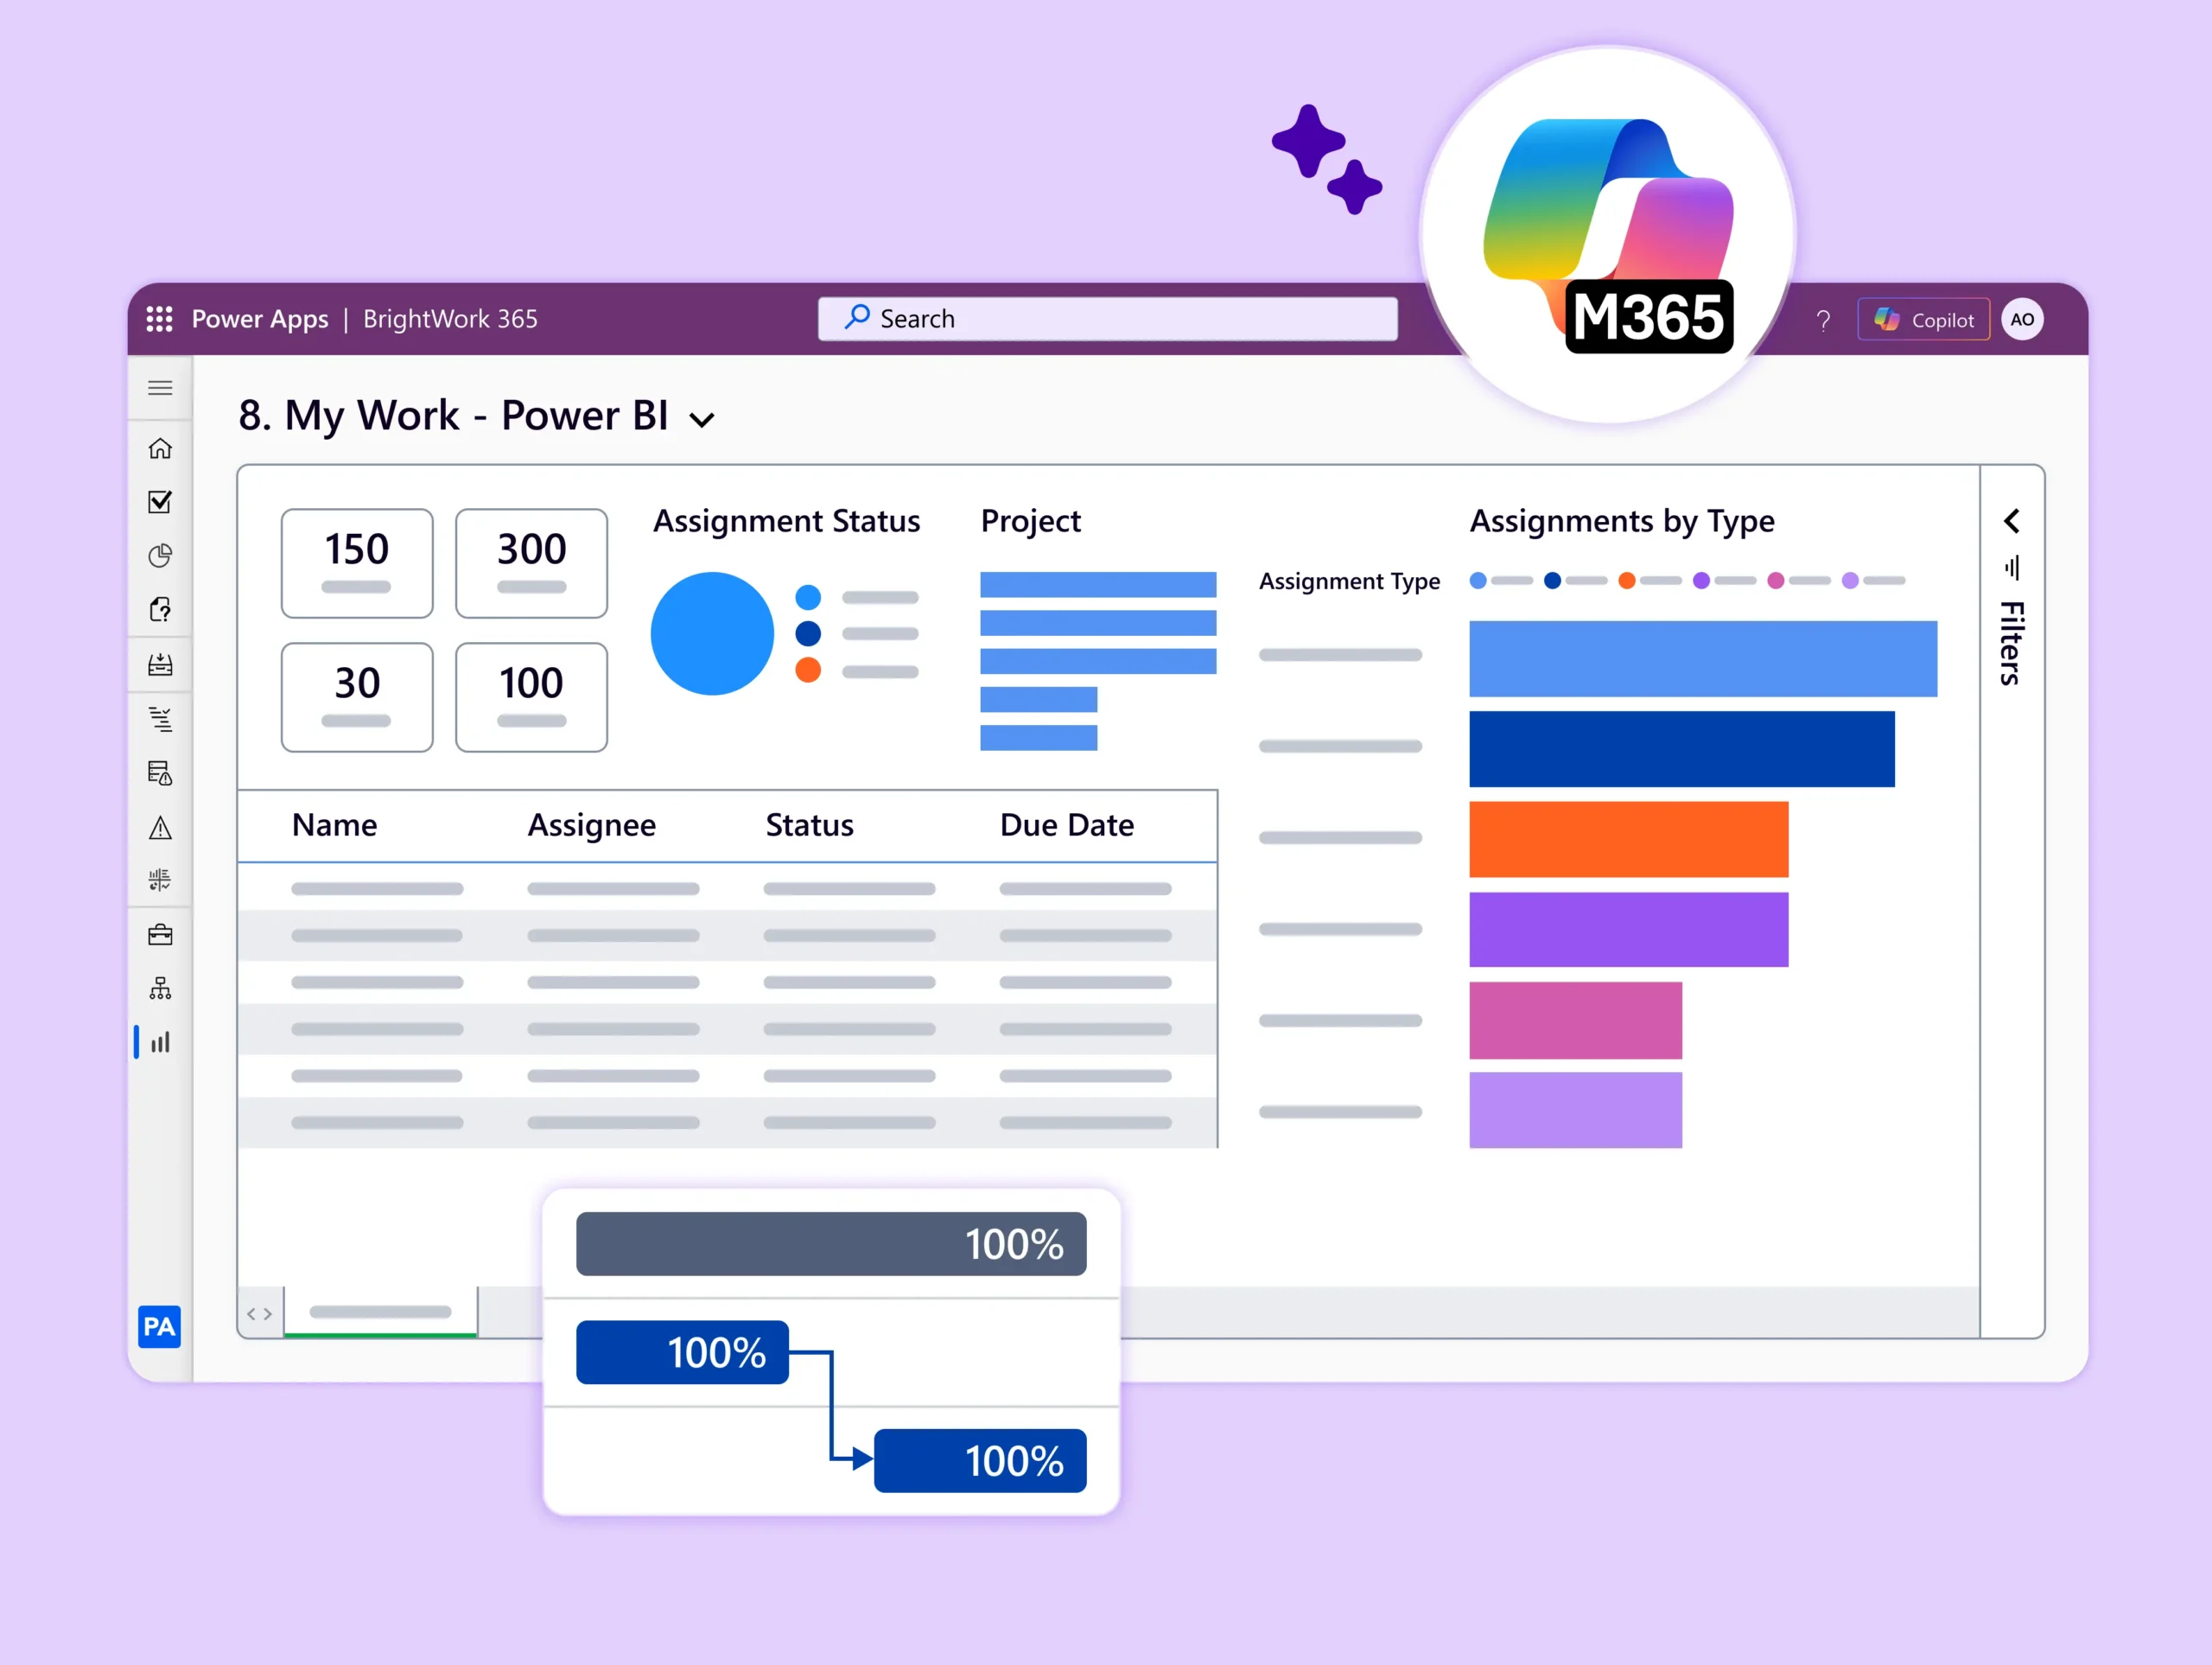
See all work (tasks, deliverables, issues, and risks) across all projects in one place.
-
Filter work using the project name, project type, project manager, and assigned person.
-
Identify team members who are under-allocated and reassign work as needed.
-
Team Members can find tasks, deliverables, issues, and risks across all projects in My Work.
Do More with BrightWork 365
-
Customize – Easily configure your BrightWork 365 solution to customize your project workflows and processes.
-
Integrate – Use Microsoft apps and the Power Platform to expand your project management capabilities.
-
Collaborate – Work with your dedicated Customer Success Partner to securely deploy, adopt, and evolve your BrightWork 365 solution.