
Introduction
Using Microsoft Power BI and BrightWork 365, anyone in your organization can connect to a data source, and build and share engaging reports – no coding or statistical skills required.
Pulling data together from multiple sources into one tool, Power BI simplifies project reporting and amplifies the management capacities of BrightWork 365 for managers, teams, and senior executives.
In this guide, you’ll learn about the benefits of using Power BI in project management and how to leverage Power BI project reporting to get maximum benefit from BrightWork 365. We’ll also cover Power BI Desktop, Power BI Service, and key components of the platform.
Challenges with Traditional Project Management Tools
A lot of the time, organizations are managing projects with email, Excel, or some other “manual” ways of tracking, making project reporting and status reports incredibly cumbersome to deliver.
Despite the critical role of project management tools, traditional methods often face significant challenges that can impact project success:
-
Data Silos: Data being stored in separate systems or spreadsheets, making it difficult to get a unified view of the project’s status and progress.
-
Lack of Real-Time Updates: Many basic tools do not support real-time data updates, leading to outdated information and delayed decision-making.
-
Limited Analytical Capabilities: Basic tools often lack advanced analytics and visualization features, making it challenging to get actionable insights from the data.
-
Manual Data Entry: Relying on manual data entry increases the risk of errors and consumes valuable time that could be spent on more strategic tasks.
-
Scalability Issues: As projects grow in complexity and size, traditional tools may struggle to scale, leading to inefficiencies and potential project delays.
-
Poor Integration: Many tools lack integration capabilities with other essential systems, resulting in fragmented workflows and inefficient processes.
How Can Project Reporting Tools Improve Project Outcomes?
By transitioning to modern, data-driven project management tools like Microsoft Power BI, organizations can centralize project reporting, leverage advanced analytics, get insights from real-time data to improve project outcomes.
Power BI simplifies and enhances project reporting for managers, teams, and senior executives. Senior executives and PMO leads get real-time visibility into performance – without having to chase updates. Interactive reports provide detailed insights into ongoing projects, with information on the schedule, resources, risks, and more. With just a few clicks, senior executives can identify issues that may have remained undetected in a spreadsheet!
Similarly, project teams can easily track performance in real-time dashboards. A low learning curve and free options allow teams to take a metrics-driven approach to projects – without relying on IT. Freed up from manual reporting, project managers can spend more time with their team.
What is Microsoft Power BI?
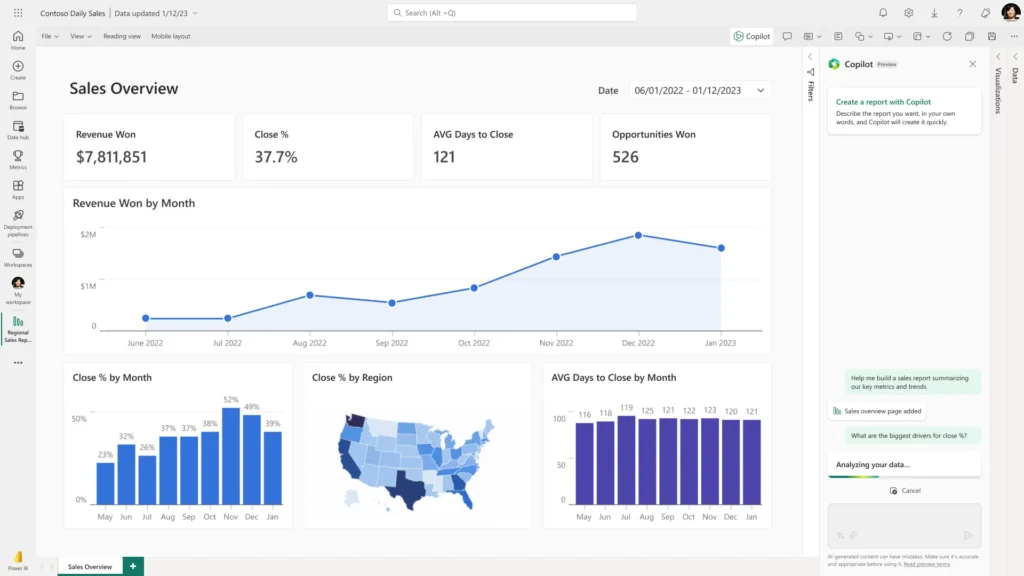
Microsoft Power BI is a suite of business analytics tools designed to help organizations analyze data and share insights. Power BI transforms raw data into meaningful, actionable information through interactive visualizations and business intelligence capabilities, making it easier for decision-makers to monitor their business operations and make informed decisions.
Power BI helps organizations to bridge the gap between rapidly expanding data sources and their ability to collect, analyze, and use that data. Power BI connects to Microsoft applications like SharePoint, Excel, and Common Data Services and non-Microsoft applications such as Salesforce. With this data in one place, you can quickly generate rich reports and dashboards to share with your team and stakeholders.
Why Use Power BI in Project Management?
Power BI helps organizations to make sense of their data and uncover actionable insights to drive work forward. At a high level, Power BI:
-
Connects to multiple data sources across the cloud or on-premise, helping to eliminate silos
-
Combines these data sources into a single report.
-
Leverages AI and machine learning for in-depth insights.
-
Allows users to ask questions with natural language processing.
-
Can handle larger datasets than Microsoft Excel, including Azure data lakes.
-
Generates engaging, interactive visualizations with a few clicks.
-
Refresh datasets at regular intervals for up-to-date reports.
-
Allows users to filter data and create personalized views without changing the underlying dataset.
-
Integrates with Microsoft Power Automate to streamline data collection.
-
Facilities collaboration with comments and sharing.
-
Offers extensive security and data protection options.
These capabilities translate into better decisions, agile teams, enhanced customer experiences, and increased productivity. Power BI supports self-service business intelligence. Business intelligence is ‘“a set of concepts, methods, applications, and technologies, which are utilized to transform raw data into meaningful information that can be utilized by stakeholders to make informed decisions.”
In other words, organizations use BI processes to collect, cleanse, and analyze data before generating rich reports. With software such as Power BI, business intelligence is no longer limited to IT teams and specialists. Anyone can access data, perform analysis, and create reports as needed.
Benefits of Using Power BI for Project Management
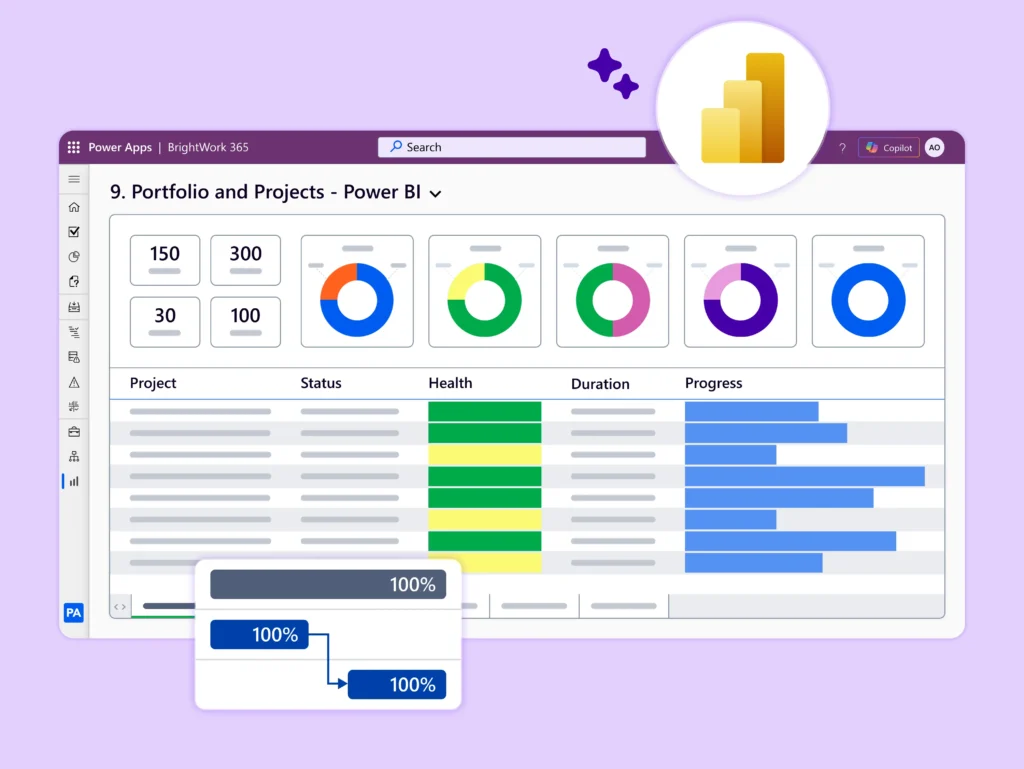
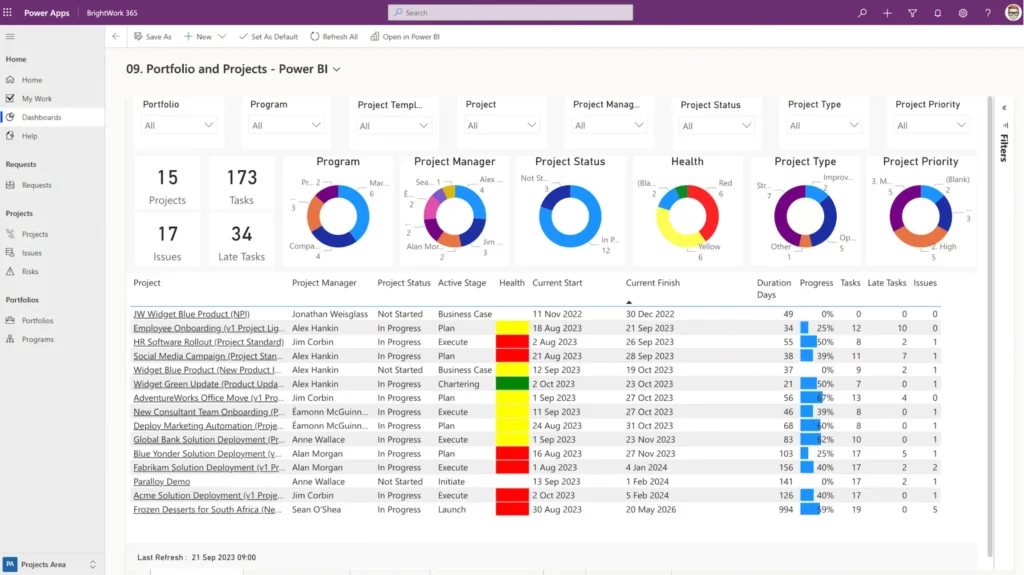
1. High-level visibility across projects with Portfolio Dashboards
Power BI in BrightWork 365 can deliver many Benefits for senior executives and PMO leads. BrightWork 365 solution teamed with Power BI creates portfolio dashboards that provide high-level immediate visibility across portfolios. Senior executives can leverage these dashboards to view multiple portfolios and programs in a single glance.
Combining all project data and key metrics in a single dashboard provides clear, accurate insight into performance and issues. Filter options, such as project type, status, or department, allow senior managers to quickly tailor the dashboard to their needs.
2. Clear visualization of the program schedule with Portfolio Timelines
The ‘Portfolio Timeline’ is an interactive Gantt chart depicting active projects across a selected period. By visualizing projects in a multi-year roadmap, senior managers can approve and resource new projects at the right time. Hover over each bar on the chart to get more information about each project, such as the start date and % complete.
Projects can be filtered by date and project manager. One can also drill into the details of each project with the help of specific reports such as Status Report Dashboard, Issue Report, Work Reports, and more.
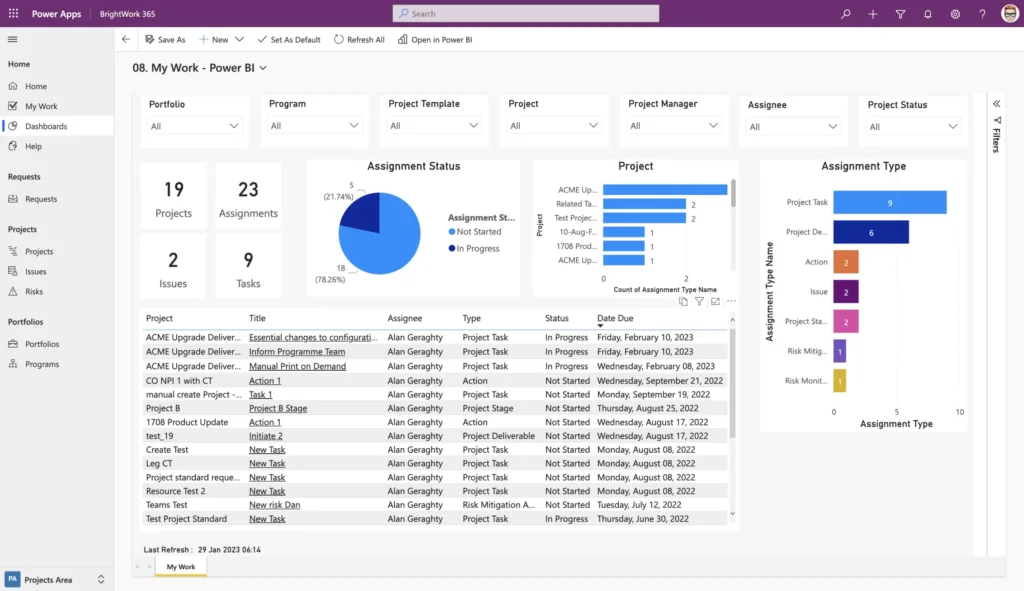
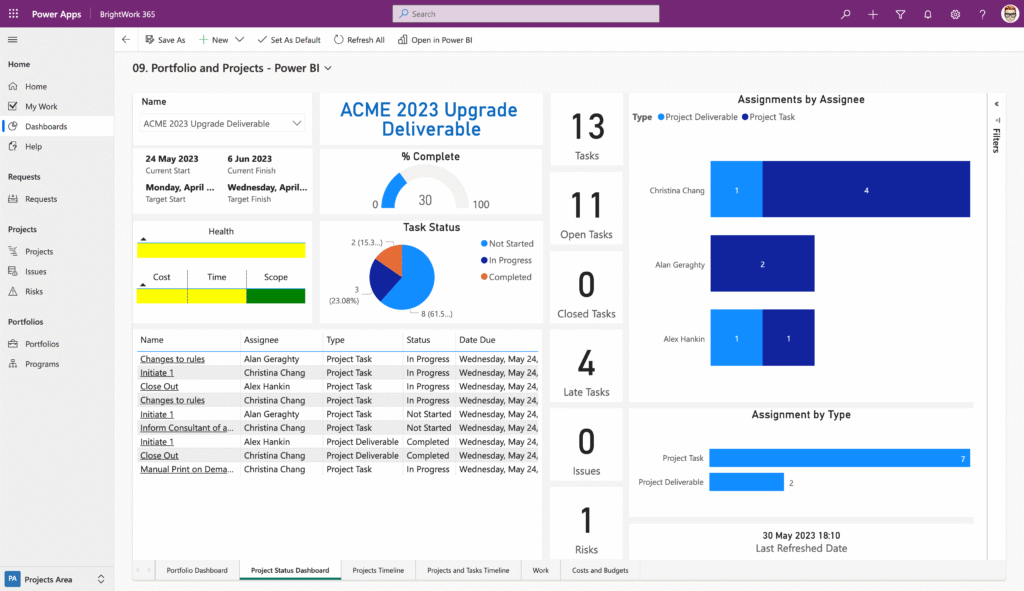
3. Efficient tracking with individual Project Status Reports
Separate project status reports make it much more efficient to track progress and add updates when required. A project status report is a useful way to capture details about a project at a given time, with red-amber-green (RAG) indicators and other relevant information.
Using the ‘Project Metrics List’ in a BrightWork 365 site, this dashboard allows project managers to filter and view data by:
-
Project name
-
Health status
-
Time status
-
Issue status
The Project Status dashboard keeps your team and stakeholders in-the-loop with accurate, visual information. Use the dashboard as a discussion point in meetings and to help with regular project re-planning. Your managers can also manage active and late items in a project. They can:
-
Drill down into projects by ‘assigned to’
-
Check the status of tasks, risks, issues, and goals
-
Review individual items in the underlying SharePoint project site
4. Leveraging Power BI Premium for Enhanced Reporting
Microsoft Power BI Premium offers enhanced capabilities that can significantly improve project management through advanced analytics, superior performance, and comprehensive data handling.
Power BI Premium significantly enhances project management capabilities by providing:
-
Dedicated cloud compute and storage resources for high performance in data processing and report generation, essential for handling large datasets and complex dashboards.
-
Advanced analytics with AI and machine learning tools, enabling predictive analytics for better forecasting and resource allocation.
-
Support for large-scale data models and integration of diverse sources like CRM and ERP systems, offering a comprehensive view of project metrics.
-
Improved collaboration is improved through features like paginated reports and extensive sharing options without needing individual licenses.
-
Enhanced data governance and security ensure compliance with organizational policies
-
Automated data refreshes and scheduled reports keep project managers and stakeholders informed with the most up-to-date information for timely decision-making.
The Project Status dashboard keeps your team and stakeholders in-the-loop with accurate, visual information. Use the dashboard as a discussion point in meetings and to help with regular project re-planning. Your managers can also manage active and late items in a project. They can:
-
Drill down into projects by ‘assigned to’
-
Check the status of tasks, risks, issues, and goals
-
Review individual items in the underlying SharePoint project site
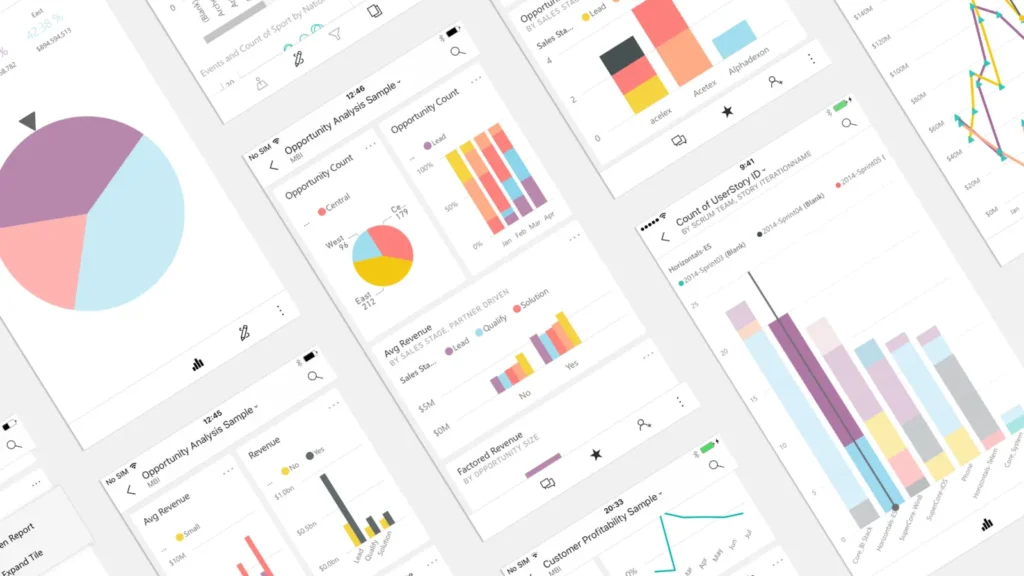
5. Accessing Power BI Reports on the Go with Mobile Apps
Accessing Power BI reports on the go with mobile apps provides significant benefits for project management reporting, enhancing flexibility, real-time decision-making, and collaboration.
Power BI mobile apps provide project managers and teams with real-time access to project data and reports, regardless of location, enabling quick decision-making and timely interventions. These apps enhance flexibility and responsiveness, allowing managers to stay connected and make adjustments while traveling or working remotely.
Collaborative features support sharing reports and dashboards directly from the app, improving team coordination. Push notifications alert users to critical updates and data anomalies, aiding in effective risk management. The user-friendly, touch-optimized interface facilitates easy navigation and detailed data analysis. Additionally, offline access to previously loaded reports ensures productivity even without internet connectivity.
By leveraging these mobile capabilities, project managers can maintain continuous oversight of project performance, enhance their responsiveness to emerging issues, and collaborate more effectively with their teams, leading to better-managed and more successful projects.
Power BI Project Dashboard Examples
Portfolio Reports
-
Current projects
-
Portfolio timeline
-
Budget
-
Resource allocation
-
Key project metrics
-
Overdue projects
-
Risks and Issues
Sharing and Using Power BI Reports
There’s little point in creating a report that no one uses or discusses! Sharing and collaborating on reports is straightforward with Power BI Service. Below, we’ll take a look at three options: comments, links, and Microsoft Teams.
You can also share reports and dashboards by:
-
Using workspaces and apps.
-
Embedding reports in secure portals or public web sites.
-
Exporting a report or dashboard as a PowerPoint presentation.
-
Printing reports.
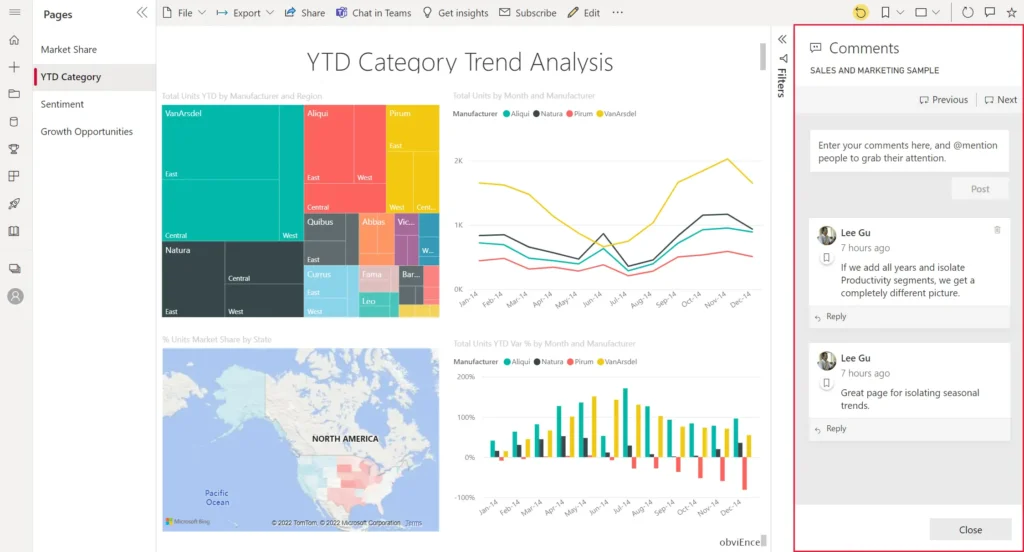
1. Adding Comments to Power BI Reports
Use @mention to tag team members and leave comments on dashboards, report pages, or specific visuals on a report or a dashboard. Tagged individuals immediately receive an e-mail notification or a push notification on the mobile app.
Power BI automatically bookmarks the report at the point of the comment, allowing others to see the report with filters, slicers, and other data views. Users simply need to click the bookmark icon in each comment to access the same view as the author at the time of commenting.
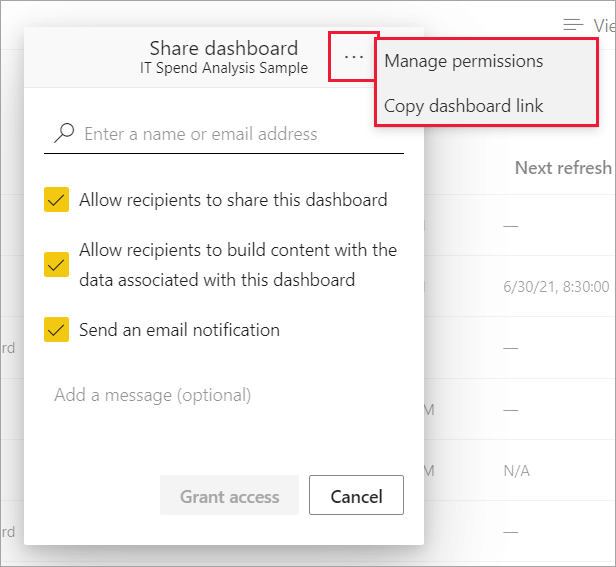
2. Sharing Power BI Reports and Dashboards
To share your report, select ‘Share’ from the top navigation, complete the form, and share it with your team. Reports and dashboards may be shared with internal and external users. You will need a Power BI Pro license to share your reports. Recipients will also need a license to view the content. When an internal user clicks the shared link, Power BI adds the dashboard or report to their ‘Shared with me list’ page.
There are a few details to note about sharing reports:
-
Recipients can view it and interact with the report or dashboard but can’t edit it.
-
Depending on permissions, internal recipients can share the reports with others. External users can’t reshare the report.
-
Reports created in Power BI Desktop must be published to Power BI Service before sharing.
3. Integrating Reports into Applications
Integrating Microsoft Power BI reports into other applications, such as Microsoft Teams, enhances collaboration and accessibility by bringing data insights directly into the workflows where teams operate. Here are some examples:
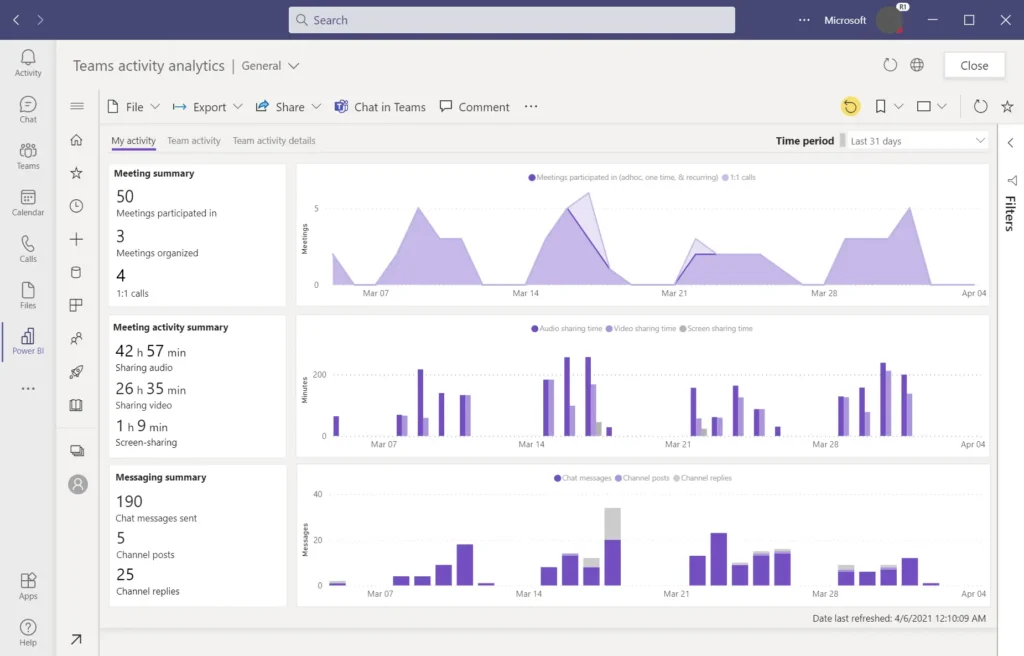
Microsoft Teams: Power BI reports can be embedded in Teams channels and chats. By adding the Power BI tab, team members can view and interact with reports without leaving the Teams environment. This integration facilitates real-time data discussions and decision-making during meetings. Users can also configure alerts and share specific report visuals in conversations to highlight key insights.
SharePoint: Power BI reports can be embedded in SharePoint Online pages using the Power BI web part. This allows organizations to create integrated portals where users can access various resources, including dynamic data visualizations, from a single location. It supports better information sharing and ensures that insights are easily accessible.
Custom Applications: Using Power BI Embedded, developers can integrate Power BI reports and dashboards into custom applications. This can be done through APIs, providing a seamless experience for users who can access analytics within the app itself. This approach is useful for ISVs and developers looking to enhance their applications with robust data visualization and reporting features.
4. Collaborating in Microsoft Teams
As the usage of Microsoft Teams increases, it makes sense to streamline conversations and meetings about reports in one place. There are two ways to collaborate with Power BI using Teams.
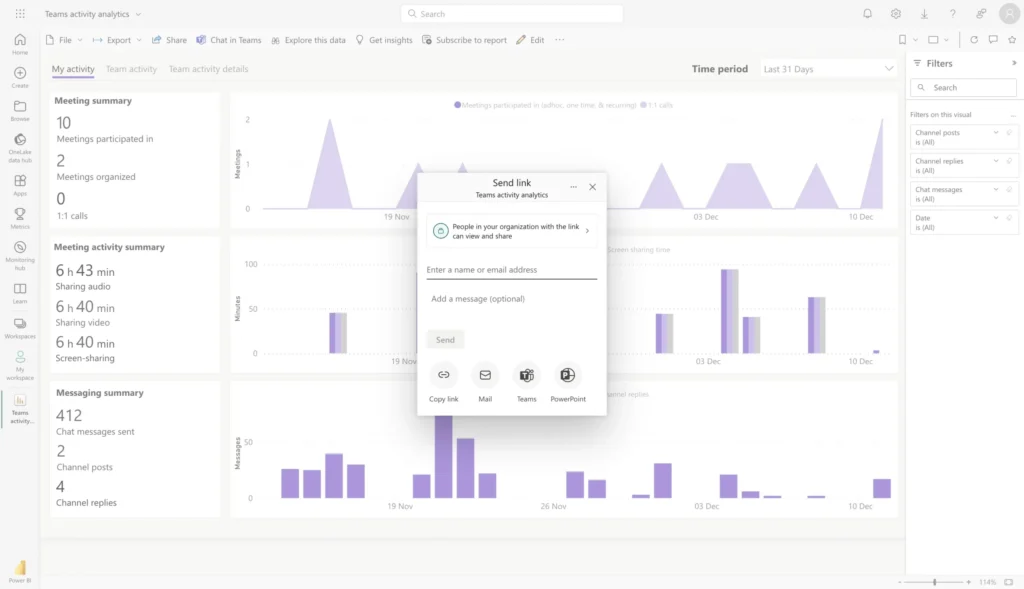
Share in Teams
Add a report or dashboard to a team or channel using the ‘Share in Teams’ option. Search for the relevant Team or channel, add a comment, and hit share! The Power BI link and additional comments appear as a post – add more comments and @mentions.
The Power BI App in Teams
Power BI is also available as an app within the Teams Directory. Use this option to add a report as a tab to a Team. This is a useful way to highlight key reports, bringing focus to a particular phase or area of work in the project.
To add the app:
Navigate to Apps in the Teams menu and search for ‘Power BI’.
Select ‘Add to a Team’ or ‘Add to a Chat’ from the dropdown menu.
Next, search for and select the relevant Team or chat.
Finally, choose the Power BI report to add as a tab.
5. Driving Data-Driven Decisions Through Collaboration
To drive data-driven decisions in project management using Microsoft Power BI, start by establishing a centralized data repository to ensure real-time access to up-to-date information for all team members.
You should also provide interactive dashboards and reports that provide insights into project progress, resource allocation, budget tracking, and risk management, allowing users to drill down into specific data points. Then you can embed these reports into collaboration platforms like Microsoft Teams to facilitate real-time discussions and decision-making within the workflow.
If you need to restrict data for some reason, implement role-based access controls to enhance data security and ensure stakeholders focus on relevant information.
By leveraging Power BI’s capabilities within a collaborative environment, project teams can make more informed, data-driven decisions, ultimately leading to more successful project outcomes.
Versions of Power BI
Power BI is available in four formats:
-
Power BI Desktop: Used to create and share reports.
-
Power BI Service: Used to create dashboards and view reports online.
-
Power BI Mobile Apps: Used to access reports and dashboards on Windows, iOS, and Android.
-
Power BI Report Server: Used for on-premises reporting, with the flexibility to move to the cloud.
Power BI Desktop vs Power BI Service
Power BI Desktop
Power BI Desktop is a free download and installs directly onto your computer. Access the download from Microsoft or within Power BI Service. Power BI Desktop is used by designers to import, transform, analyze, and visualize data using the components outlined in the previous section. It is the authoring tool within Power BI. Reports are published to Power BI Service for end-users.
Power BI Desktop has three views to work within:
-
Report: Build reports and visuals. This page remains blank until the first visualization is added.
-
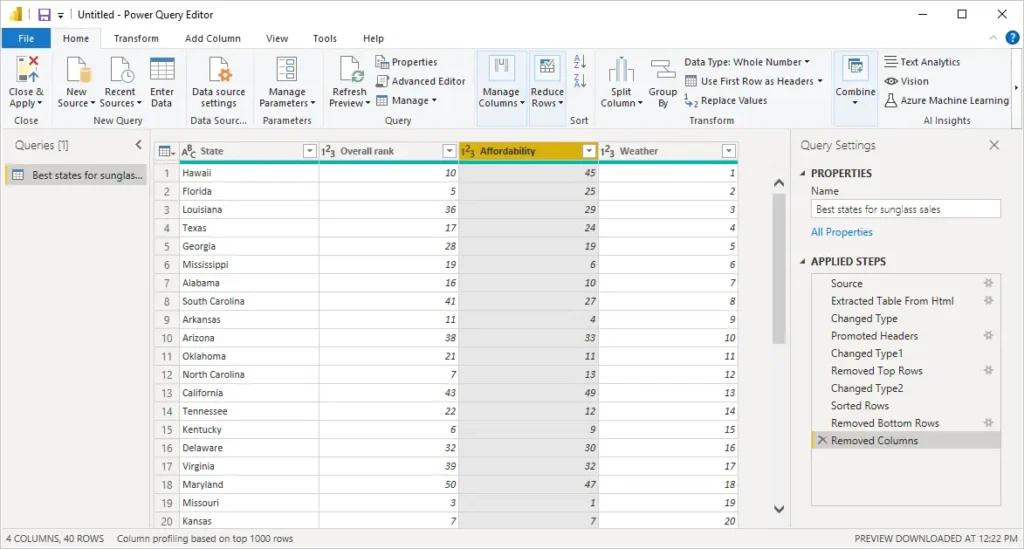
Data: Transform data using Query Editor.
-
Model: Build relationships between tables with a drag and drop interface.
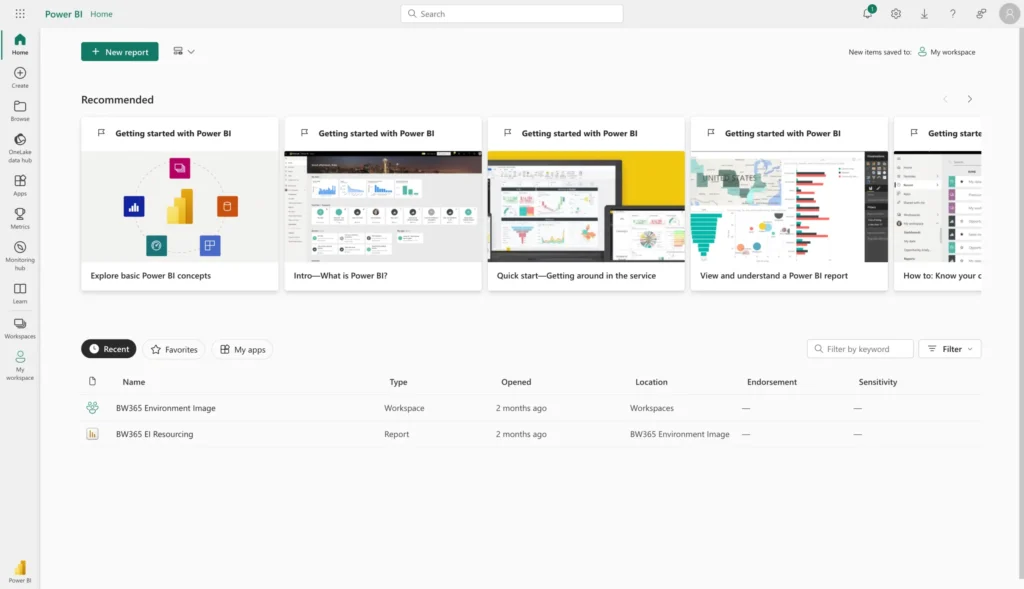
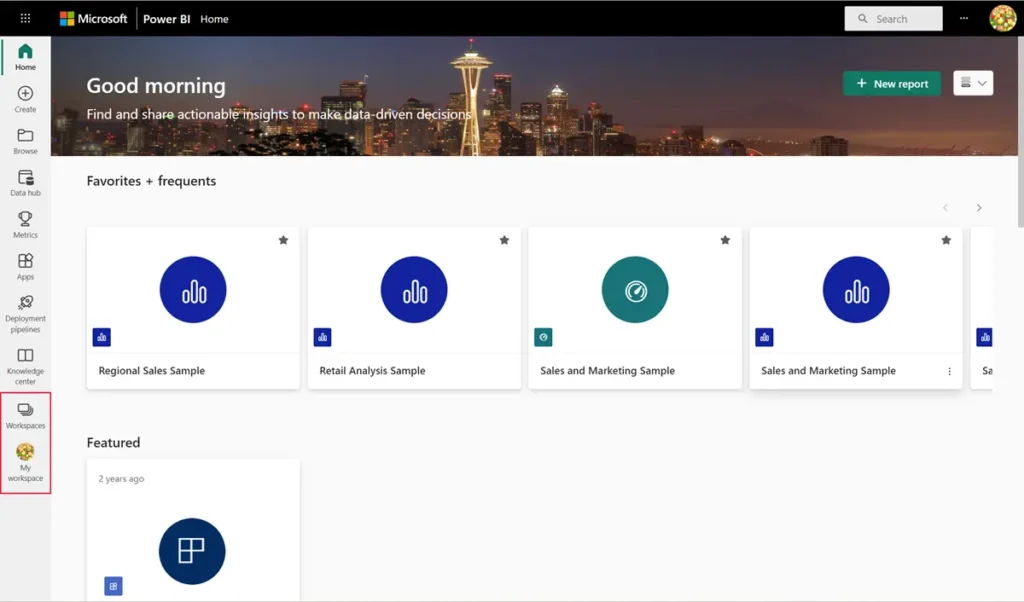
Power BI Service
Power BI Service is a cloud-based application for consumers, anyone who receives and interacts with reports and dashboards. Users can create dashboards, comment on reports, or collaborate in Microsoft Teams. Power BI Service is based on ‘workspaces’, which contain links to dashboards, reports, and datasets. Use ‘My Workspace’ for personal reports and ‘Workspaces’ for shared data, reports, and dashboards.
Power BI Service users must have a license:
-
A free license allows users to work on personal reporting and visualizations in the ‘My Workspace’ area. Users can also view any reports shared with them.
-
A Power BI Pro license is required to publish content to other workspaces and share dashboards ($9.99 per user per month).
Desktop or Service?
At this point, you may be wondering if you should build your project reports in Power BI Desktop or Power BI Service? The simple answer is Power BI Desktop! Using this application to import and transform data, create models, and generate rich reports will generate new insights about your projects.
Power BI Service does not support data editing or modeling. However, Power BI Desktop does require practice and knowledge of data modeling. It’s essential to use the Query Editor and Model tool correctly before creating any visualizations.
If you are using a clean dataset and need to create reports and dashboards to share reports with your team, Power BI Service is the right tool. Below is a brief comparison between Power BI Desktop and Service.
| Desktop | Service | |
| Cost | Free | A free license to create reports. A paid license to share reports. |
| Data Sources | Import data from a wide range of sources. | Import data from a wide range of sources. |
| Data Sources | One data set per report | 1 or more reports & data sets per dashboard. |
| Data editing | Transform (clean) data for usage. | Use original data. |
| Analysis | Analyze data using models and DAX functions. | Generated by Power BI |
| Visualizations | Build and edit visualizations | Build and edit visualizations |
| Dashboards | No | Create and share |
| Workspaces | No | Yes |
| Commenting | No | Yes |
| Sharing | Publish to Power BI Service to share. | Can share with internal/external users. |
In the next section, you’ll see how to create a report and dashboard in Power BI Service. The example is based on the free Supplier Quality Analysis sample from Microsoft.
How to Create a Report with Power BI Service
-
Start by getting your data. There are a number of ways to import data from within your organization, file directories, and databases. In this instance, we’ll select Samples and import a pre-configured dataset. The dataset will appear in your workspace in Power BI Service. (Remember to save your work.)
-
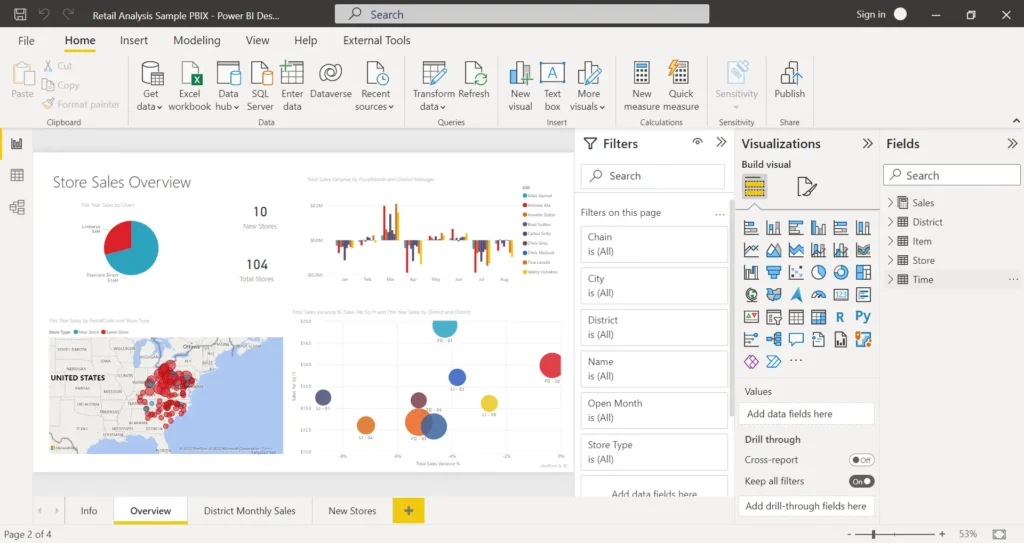
Next, select ‘Create Report’ to open the report builder. There are 3 elements in this area: Canvas. This area is blank until visuals are added. Visualizations pane: Use to add and edit charts. Fields pane. A list of the fields in your dataset, based on the columns in your dataset.
-
To start building a report, you can either select the relevant fields from your data or pick a visualization. The visualization is displayed on the blank canvas.
-
To add a field to your report, simply click the relevant field. Power BI will automatically add the field to the right area in your chart. You can also drag and drop fields into the axis, legend, and values area.
-
As you add fields, the chart will start to take shape. If needed, change the chart by selecting another option in the Visualizations pane.
-
Once you are happy with the data visualization, it’s time to format the chart. Click the ‘format’ icon to access a range of options, including the size and colors of the chart, borders, and tooltips. If you’d like to add a title or details to the report, click the ‘Text box’ option in the top menu.
-
Use the ‘Reading View’ to check how the report will appear to others.
-
Next, create a dashboard by selecting ‘Pin to a live page’. You can add the report to an existing dashboard or build a new dashboard. Dashboards offer numerous editing options, including the ability to add more tiles and different content types.
-
When you’ve finished your work, there are a few ways to use your reports under File: Export reports to PowerPoint / PDF or Embed in a SharePoint site.
-
At any time, personalize your display settings using ‘View’. Change the size of the report and colors for improved readability.
Key Elements of Power BI Reporting
Before creating your first Power BI report, it’s helpful to understand the services you’ll use to import and transform data and create visualizations for a project in BrightWork 365. If you use Excel, you will be familiar with many of these concepts and services. For an exhaustive list of terms and concepts, bookmark Microsoft’s glossary for Power BI consumers!
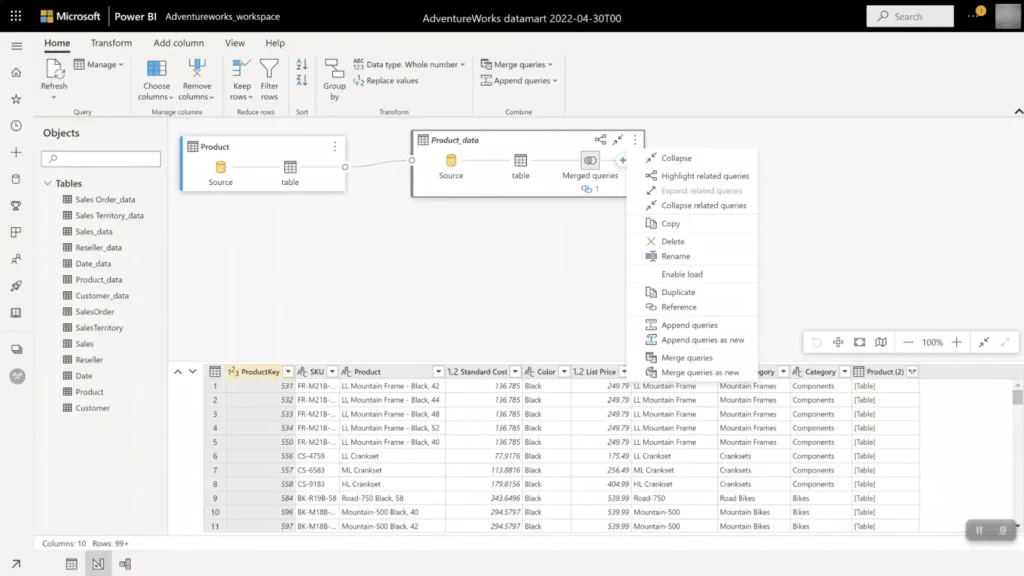
1. Power Query – Desktop
Power Query is the engine for importing data and transforming (cleaning) data. Data is imported through a simple interface and transformed using the ‘Power Query’ editor before loading into the report area. Changes applied in the Power Query editor do not impact the underlying dataset.
Options include:
-
Add or remove rows and columns
-
Separate rows or columns
-
Remove null values
-
Remove rows with blank values.
2. Power Pivot – Desktop
Power Pivot is used for creating data models – relationships between tables – and performing calculations. Calculations use DAX – Data Analysis Expressions – to analyze data. DAX statements are similar to Excel functions. Power BI includes over 600 DAX functions such as sum, average, max, and count. Users can also create custom functions.
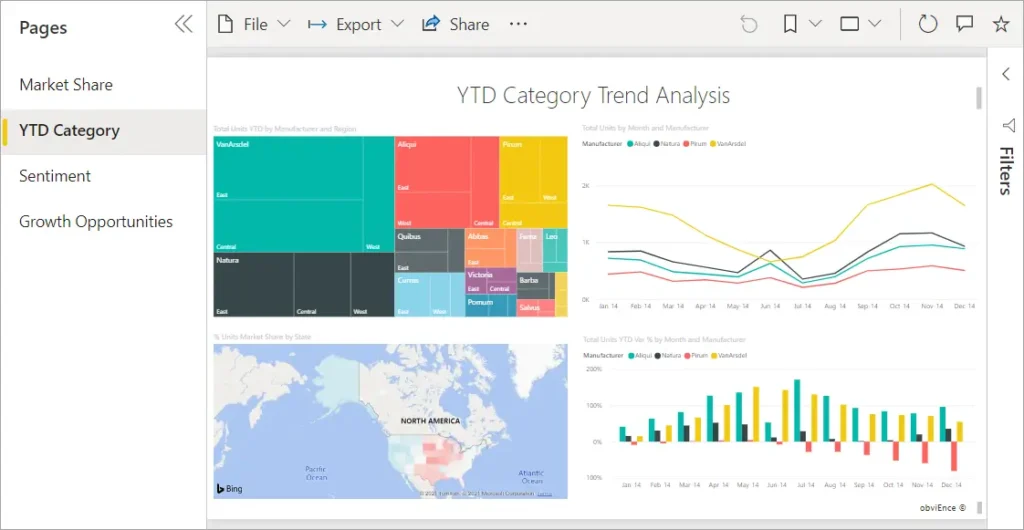
3. Power View
Power View delivers data visualization in various Microsoft applications, including Power BI, SharePoint, and Excel. Visualizations are used in reports and dashboards in Power BI to help users to understand complex information quickly. Options include area charts, funnels, line charts, maps, tables, and KPIs.
4. Power BI Reports
A Power BI report refers to a collection of visuals and can span multiple pages. Reports connect to one dataset, or data model, only. Power BI can combine multiple data sources into a single report. Power BI reports are interactive, with options to filter, slice, and drill-down. Automatic refresh updates all visuals in a report based on a fixed interval, for example, every hour, or based on changes in the data.
5. Power BI Dashboards – Service
A Power BI dashboard is a one-page summary of your data, with visualizations or tiles. Each tile links to an underlying report, making it easy to drill-down for more detail as needed. A dashboard can contain links to multiple reports, providing a quick overview of your data in one place.
As mentioned above, Power BI is available as a desktop or cloud-based service. The version you use depends on what you need to do with Power BI. Let’s take a further look at Power BI Desktop and Power BI Service.
6. Creating Interactive Dashboards for Business Users
Interactivity is a key feature in all Power BI dashboards. The interactive elements enable users to update the dashboard data dynamically, making it easier to explore and analyze information.
Here are the main aspects of interactivity in Power BI:
-
Slicers: These are on-screen controls that allow users to filter data based on specific criteria, such as dates, categories, or numerical ranges.
-
Cross-Filtering and Cross-Highlighting: When users select data points in one visualization, Power BI can automatically filter or highlight related data in other visualizations on the same dashboard. This interconnectedness allows users to see how data points are related across different charts and graphs.
-
Drill-Through: This feature enables users to click on a data point in a visualization and navigate to a detailed report or another page that provides more in-depth information about that data. Drill-through helps in performing detailed analysis without cluttering the main dashboard.
-
Tooltips: Enhanced tooltips provide additional context when users hover over data points. These tooltips can display extra data, images, or even other visualizations, offering deeper insights without taking up dashboard space.
-
Bookmarks and Selections: Users can create bookmarks to save specific views and selections within the dashboard. These bookmarks can be shared, allowing others to view the data from a particular perspective instantly.
7. Data Connectors
Data connectors in Power BI enable the dashboards to access and retrieve data from various sources like timesheet software or financial systems, for example. Data connectors ensure that organizations can report on all necessary data sources within the Power BI environment, delivering the most comprehensive reporting to teams and executives.
This capability is crucial for organizations with diverse data ecosystems feeding into the project management office, ensuring that all relevant data can be incorporated into their BI processes.