
Key Takeaways
Sharing Power BI reports is essential for keeping teams, stakeholders, and executives aligned on real-time data.
In this article, you’ll learn the most effective ways to share Power BI reports, including when to use direct sharing, Microsoft Teams, and workspaces. You’ll also understand key limitations, permissions, and best practices to ensure secure and scalable collaboration.
4 Ways to Share Power BI Reports and Dashboards
Professionals often need to share Power BI reports and dashboards to ensure team members, stakeholders, and clients are aligned with the latest data insights and business intelligence. This includes learning how to share Power BI reports with non-Power BI users.
This can be critical for making data-driven decisions and maintaining transparency. Here are four effective ways to share Power BI reports and dashboards.
1. Adding Comments to Power BI Reports
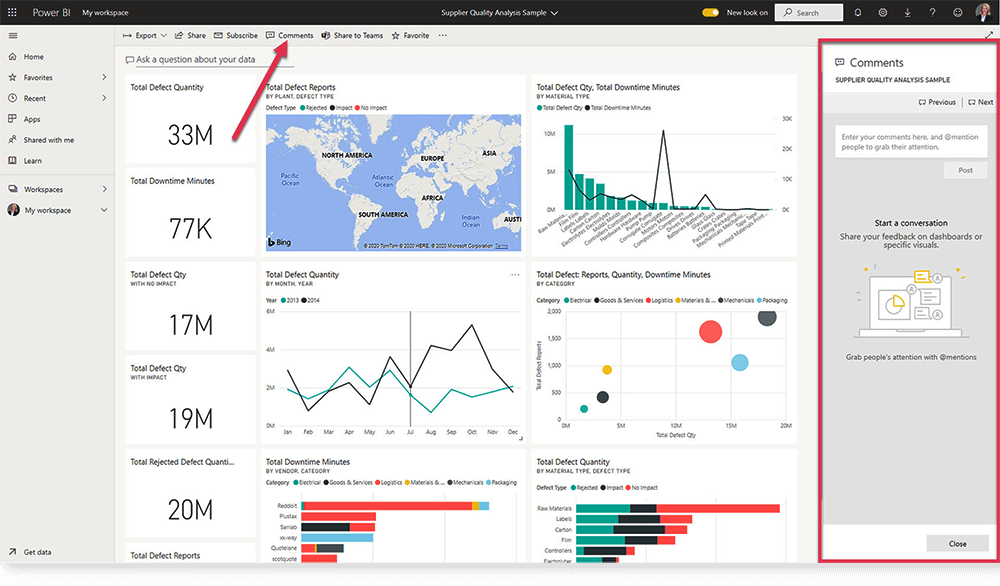
Commenting is an easy way to kickstart the conversation.
Add comments to dashboards, reports, and specific visuals on a report or a dashboard.
Here’s how you can open up the Power BI Service Dashboard comments:
Here’s how you can add a comment on a visual in a Power BI dashboard:
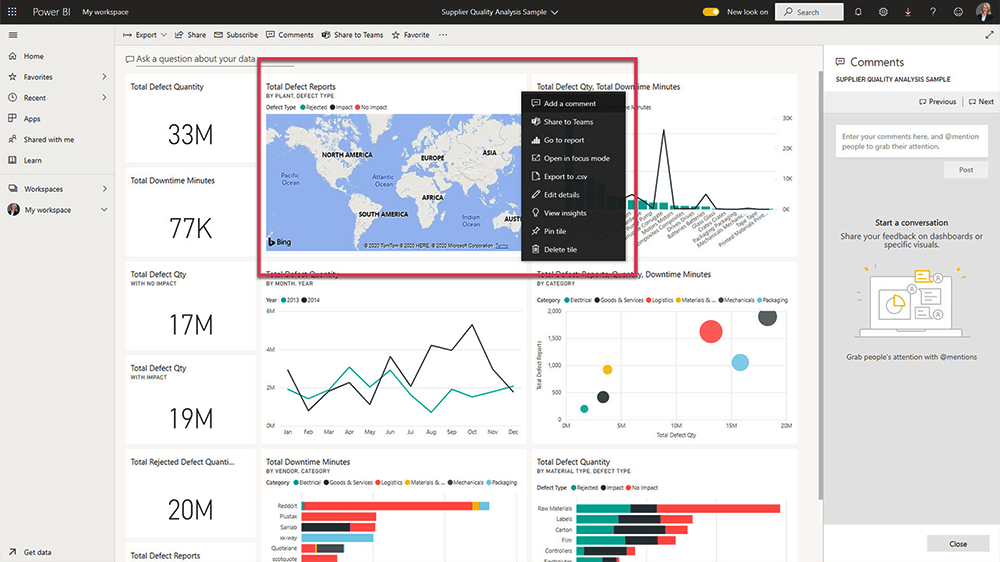
Use @mention to tag team members.
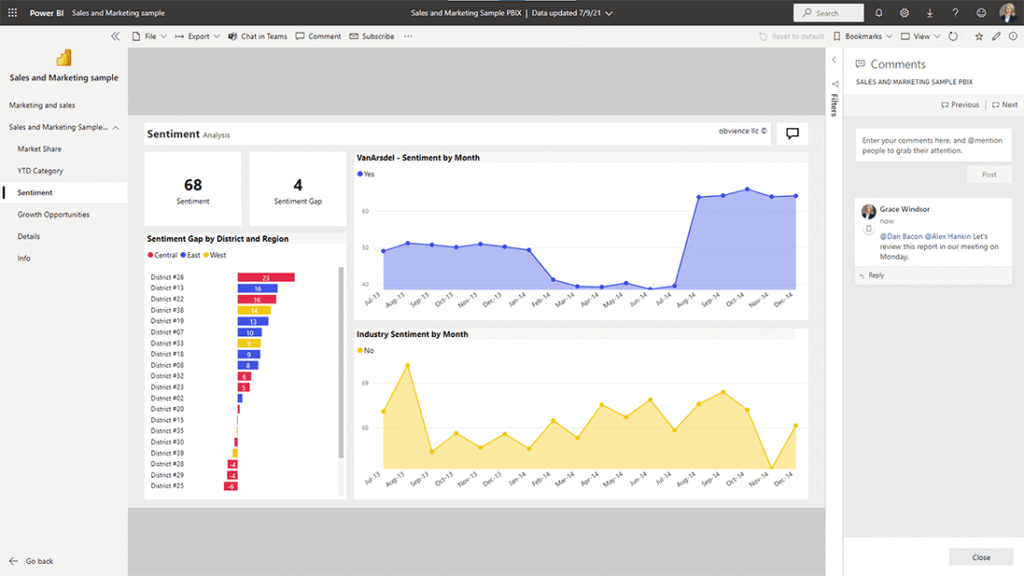
Tagged individuals immediately receive an e-mail in their inbox, and if they are using a Power BI Mobile app, they will receive a push notification on their device about the conversation.
Applied filters to the report that you’d like to discuss? Power BI automatically bookmarks the report at the point of the comment, allowing others to see the report with filters, slicers, and other data views.
Users simply need to click the bookmark icon in each comment to access the same view as the author at the time of commenting.
2. Sharing Power BI Reports and Dashboards
To share your report or dashboard, select ‘Share’ from the top navigation, complete the form, and share it with your team. Share reports from Favorites, Recent, and My Workspace.
Reports and dashboards may be shared with internal and external users. You’ll need a Power BI Pro or Premium Per User license to share content; users will need the same license to view the content.
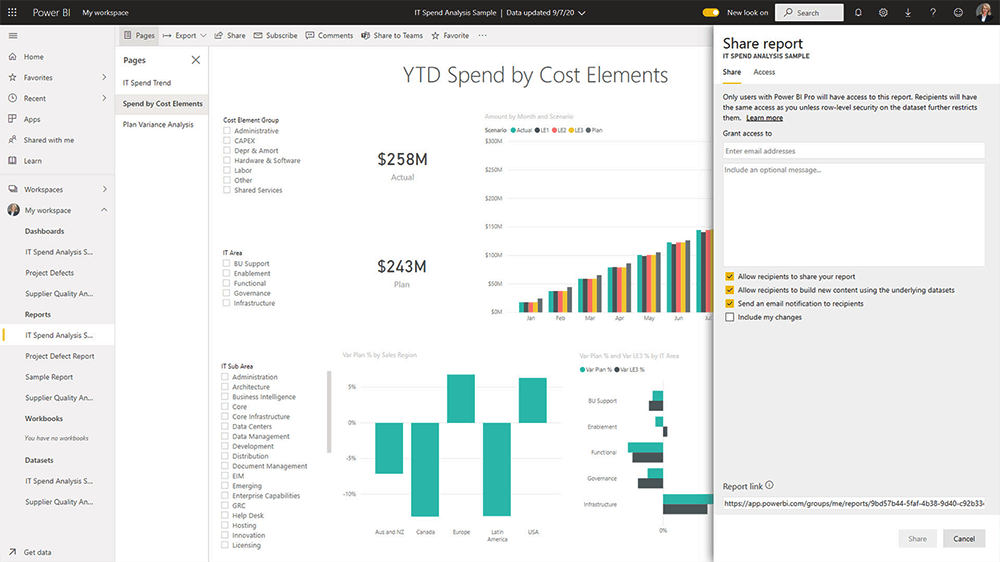
Power BI Service Sharing a Report
When an internal user clicks the shared link, Power BI adds the dashboard or report to their ‘Shared with me list’ page. This “power bi share report” feature ensures seamless distribution and access control within your organization.
There are a few caveats to note about Power BI report sharing:
-
Recipients can view and interact with the report or dashboard but can’t edit the item, which is important if you can’t share reports.
-
Depending on permissions, internal recipients can share the reports with others. External users can’t reshare the report.
-
Reports created in Power BI Desktop must be published to Power BI Service before sharing.
Further details on sharing, including permissions and limitations, are available from Microsoft.
3. Collaborating in Microsoft Teams
As the usage of Microsoft Teams for project management increases, it makes sense to streamline conversations and meetings about reports in one place.Adding Power BI reports to Teams reduces the need to switch between apps during meetings. This saves time and ensures everyone is viewing the same data.
There are two ways to collaborate with Power BI using Teams.
Share in Teams
Add a report or dashboard to a team or channel using the ‘Share in Teams’ option.
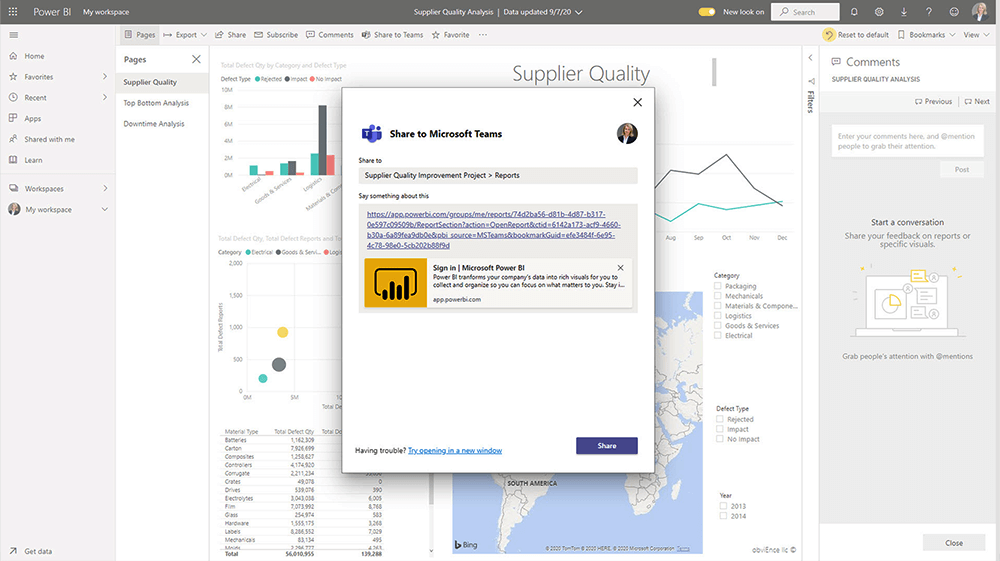
Power BI Services Microsoft Teams
Search for the relevant Team or channel, add a comment, and hit share! The Power BI link and additional comments appear as a post – keep the conversation going with more comments and @mentions.
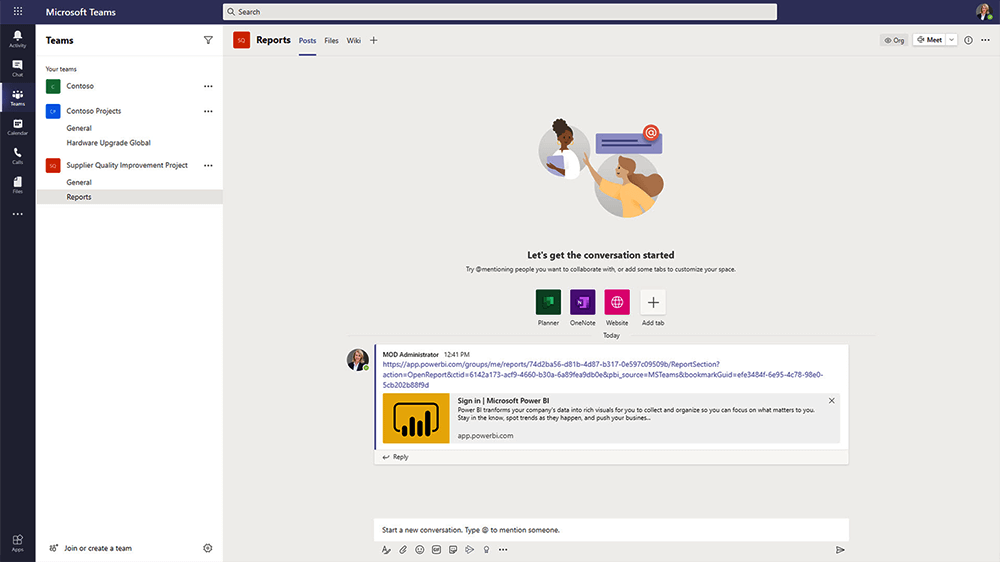
Power BI Service Share Link in Teams
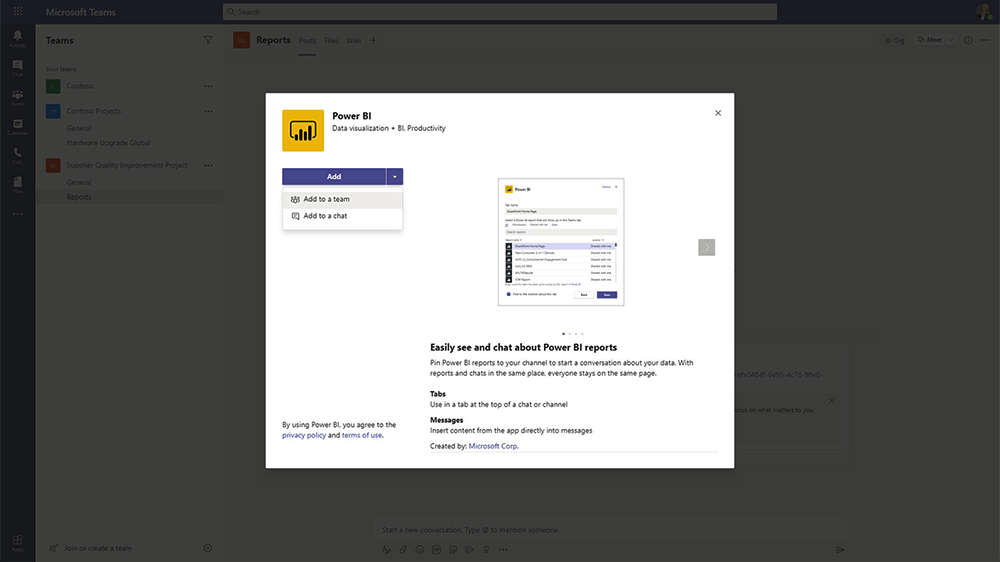
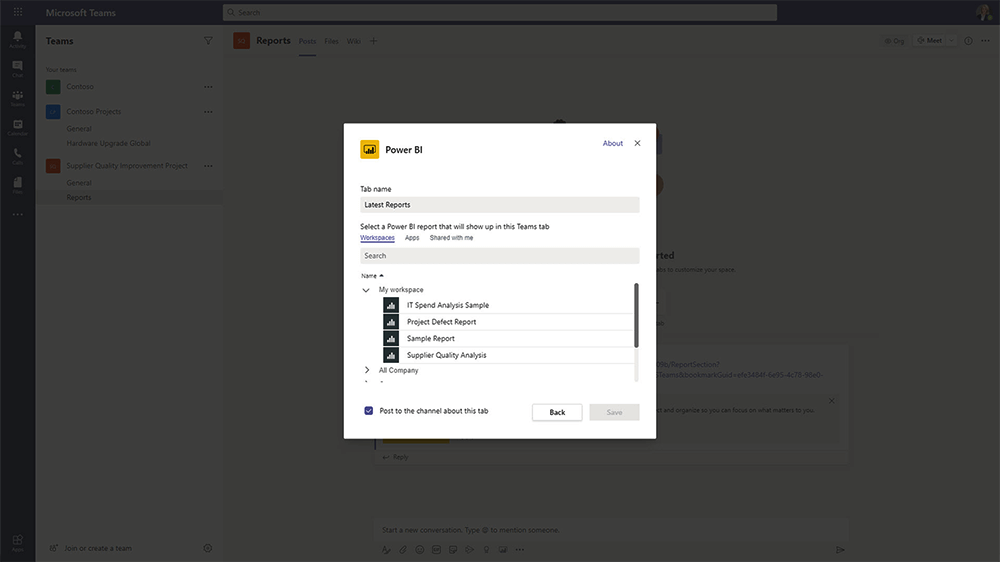
The Power BI App in Teams
Power BI is also available as an app within the Teams Directory. Use this option to embed a report as a tab to a Team. Note – it is not possible to add dashboards as a tab.
Adding a Power BI tab is a useful way to highlight key reports, bringing focus to a particular phase or area of work in the project.
To add the app:
-
Navigate to Apps in the Teams menu and search for ‘Power BI’. You can also click ‘+’ in the top menu in the relevant team and select ‘Power BI’.
-
Select ‘Add to a Team’ or ‘Add to a Chat’ from the dropdown menu.
-
Next, search for and select the relevant Team or chat.
-
Choose the Power BI report to add as a tab.
Use the Power BI report in Teams!
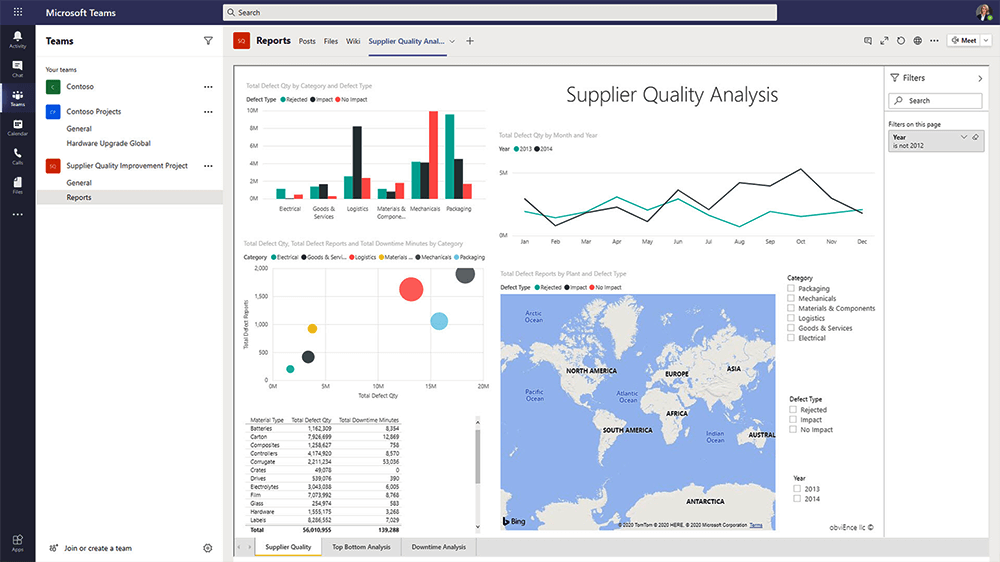
To view the report, users:
-
Must have permission to view the report in Power BI.
-
Must be Microsoft Teams users with access to channels and chats.
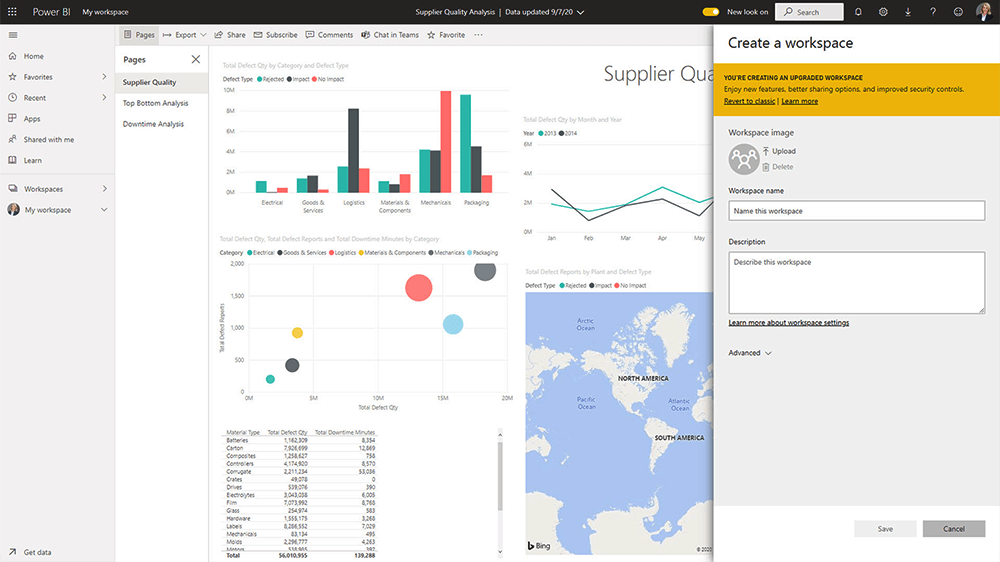
4. Power BI Workspaces and Apps
Power BI Service is based on ‘workspaces’, which contain links to dashboards, reports, and datasets.
Workspaces are a collaborative space for dashboards, reports, and datasets, with varying levels of permissions.
Users can add workspaces for teams, projects, and departments – whatever makes sense for the team and organization.
Workspaces are based on either the classic or new experience. This article from Microsoft explains the differences between these options.
‘My Workspace’ is ideal for personal content, similar to OneDrive or a personal document folder. Avoid using this area to create reports and dashboards for sharing with your team, especially if you can’t share reports effectively.
Reports created in Power BI Desktop are published to workspaces.Report designers also use Workspaces to create and share Apps, a collection of reports and dashboards available to internal users.
Apps are a handy way to share reports with particular user groups, such as stakeholders. End-users can filter, slice, and drill-down into the reports in the app; however, they are unable to change the contents of the app.
A Power BI Pro license is required to create, share, and view apps. Using Power BI in project management can greatly enhance collaboration and data sharing within your team, ensuring everyone has access to the necessary insights.
Enhancing Project Management Processes with Power BI
Efficiently sharing Power BI reports greatly enhances project management processes. By providing all team members and stakeholders involved in the project life cycle access to the latest data, you enable better decision-making and streamline project execution.
This practice ensures alignment with the project charter and helps meet key performance indicators effectively.
Frequently Asked Questions About Sharing Power BI Reports
1. Can you share a Power BI report with external users?
Yes, Power BI reports can be shared with external users depending on permissions and licensing. External users typically cannot reshare the report.
2. Do users need a license to view a Power BI report?
In most cases, users need a Power BI Pro or Premium Per User license, unless the report is hosted in Premium capacity.
3. Can you share a Power BI report in Microsoft Teams?
Yes, you can share Power BI reports directly in Teams or add them as tabs for ongoing collaboration.
4. What is the difference between Power BI workspaces and apps?
Workspaces are collaborative environments for creating and managing reports, while apps are packaged collections of reports shared with end users.
5. Can recipients edit a shared Power BI report?
No, recipients can view and interact with the report but cannot edit it unless they have workspace-level permissions.