Project Metrics
This guide will provide an overview of some of the configuration changes you can make to lists in BrightWork so that your local needs and practices are better supported.
1. Introduction
The Project Metrics list enables you to track and capture project metrics that give you and the other project stakeholders an easy and objective way of measuring the progress of the project.
As with most other aspects of BrightWork, Project Metrics can be configured to better match your own project management methodology and processes.
Prerequisites
You will have created a Training Project Office as per the Create a Training Project Office in the Introductory Guide. Ideally, you will also have completed the Project Manager Guide.
Suggested Exercises
At the end of nearly every chapter you will see some Suggested Exercises that you should be able to complete on your own, based on what you have just done.
These suggested exercises will not contain any steps- you will need to apply what you have learned to do the exercise.
We recommend you complete these suggested exercises, as they will help to reinforce what you have learned.
2. Metrics 101
In this section, you will learn about the basics of the BrightWork Project Metrics list.
Introduction
A metric is an analytical measurement intended to quantify the state of a system; for example, population is a metric. Metrics matter because they enable planners to make decisions on the basis of empirical data.
Project metrics are important because they give you and the other project stakeholders an easy, objective and scientific way of measuring the progress of the project, and also the grounds with which to make important decisions as to the direction and scope of the project.
BrightWork facilitates the creation of four different Metric types:
-
Manual Date
-
Manual Number
-
Calculated Date
-
Calculated Number
Manual vs. Calculated
The majority of metrics available in BrightWork are automatically calculated by querying either a list or by querying a BrightWork report. These metrics are known as calculated metrics.
The difference between querying a list and a BrightWork report is quite simple – BrightWork reports enable you to report on multiple lists in multiple sites.
You can also specify the metric value yourself. These metrics are known as manual metrics. You might create a manual metric if the source metric data existed outside of BrightWork or was a fixed date or number.
The type of calculation available depends on the type of metric (see next section).
Metric Types
The BrightWork Metrics list returns to types of data: Dates and Numbers.
Date Metrics
Examples of date metrics include:
-
Planned Finish Date
-
Actual Start Date
With Calculated Date Metrics, you can return the earliest or the latest date within the dataset.
Number Metrics
Examples of number metrics include:
-
Number of ‘Overdue Tasks’
-
Sum of ‘Actual Work’
-
‘Estimated Cost to Complete’ the Project
With Calculated Number Metrics, you can return:
-
Number of items returned
-
Average
-
Maximum
-
Minimum
-
Sum
Note: The majority of metrics in BrightWork are Calculated Number Metrics.
Supplied Metrics
Four of the templates supplied with BrightWork come preloaded with metrics. Not all of these metrics are active.
The templates that include metrics and the number of active over available metrics in them are:
-
Project Lite (6/18)
-
Project Standard (7/27)
-
Project Structured (22/59)
-
Project Office (11/11)
Note: The figures above are subject to change with future BrightWork product updates. See the Supplied Metrics BrightWork help topic for a detailed current list of the metrics supplied with BrightWork.
Metric Indicators
Metrics by themselves are quite useful pieces of information but knowing whether the information being returned is good or bad for the project is where they become truly beneficial to project management.
The BrightWork Metrics list enables you to set a standard by which you judge the metric:
-
On Target
-
Warning
-
Danger
The Metric list assigns the above default icons to each metric state but you can set custom icons if you wish.
The Warning and Danger icons are triggered by thresholds you define. You select another metric to compare the metric to (or manually specify a fixed number or date) and specify thresholds for the warning and danger levels.
For example, if the project’s current scheduled finish date is after the project’s initial planned finish date by a small number of days, the Warning icon might appear for the ‘Time’ metric, but if the number of days exceeds this small number of days then the Danger icon will appear.
3. Use Metrics
In this section, you will learn about using the out of the box metrics in your projects.
Introduction
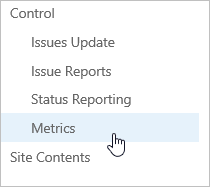
Navigate to the Project Standard site you created in the Create a Training Project Office training module (it should be called Hyper V Deployment) and click Metrics on the Quick Launch.
Individual Metrics
All the items displayed here are individual metrics. The actual value of the metric is displayed in the Formatted Metric Value column
Click the % Complete metric.
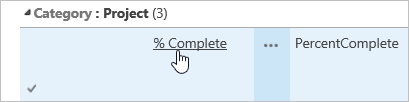
The form displays a lot of information about the individual metric. The main areas of interest are the Metric Indicator Details and the Metric Calculation Details sections. The information in the Metric Value field for this particular metric is generated via promotion from the Tasks list. For more information about promoted metrics, see BrightWork Help.
Metrics in Reports
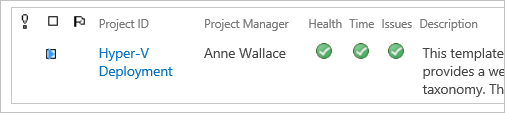
By themselves, metrics are useful pieces of information but their real value is when they are used in Project Reports. Return to the Supplied Metrics help topic you just looked at. Notice the metric titles that are bolded. These are available in the All Projects Summaries report that drives most of the project level reports. The icon reports on the project home page use this report.
Click Project Home on the Quick Launch and then the Project Status tab on the project home page. The displayed report at the top of the page also uses the Template Projects – Project Summary report.
Use the Navigation helper to navigate to your training Project Office.
The data in the Project Office Summary report is supplied by the Metrics list in the Project Office. All the metrics in this list are calculated. The data in the Project Summaries report is rolled up from the Tracker list in the Project Office and data from the child sites under the Project Office.
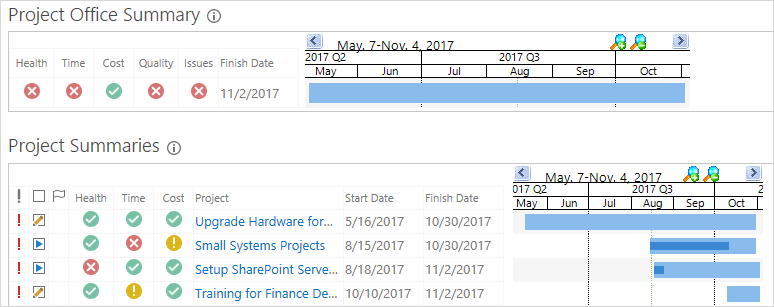
The data from the sites under the project office is taken from the Project Metrics list (via Project Metric Joins), the Projects Tracker list and the Project Statement in those sites in that order of supremacy.
Note: This guide does not cover how to add metrics to reports. This is covered in the Working with Report Data Sources training guide.
Metrics Scorecard
The Metric Scorecard web part enables you to display the history of multiple metric items from a specified Metric list. This web part has been added to the Dashboard tab on the Project Lite, Project Standard, Project Structured and Project Office templates.
-
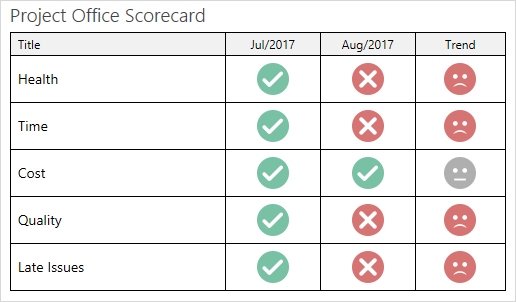
Click Status Charts on your Project Office home page.
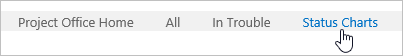
-
The Project Office Scorecard displays the history of all the main metrics relating to the project office. It also can include a Trend icon that will notify you of any recent changes (good or bad) in each metric item.
Metrics Recalculate
To ensure that the data displayed in the Metrics list is up to date, it must be periodically recalculated. This can be done manually or automatically on a server-side timer job.
Timer Job
The timer-job is a server side feature that automatically runs the Metrics Recalculate according to a predefined schedule. The default setting is to run in the middle of the night every 24 hours; however, you could change this to hourly if you needed it. Activating and configuring the server-side timer job is an administrator task that requires access to the server, so we will not perform it here. If you would like to know more about the timer job, see the associated Help article.
Manual Recalculate
Metrics can be manually recalculated on a metric by metric basis by simply opening a metric for editing and saving it. We will see this in a later exercise. Metrics can also be manually recalculated on a full Metrics list basis using the Metrics Recalculate button that you used previously. To manually recalculate a Metrics list:
-
Return to the site you created using the Project Standard template- it should be called Hyper V Deployment.
-
Click Project on the Ribbon.
-
Click Refresh Project Data, then click OK.
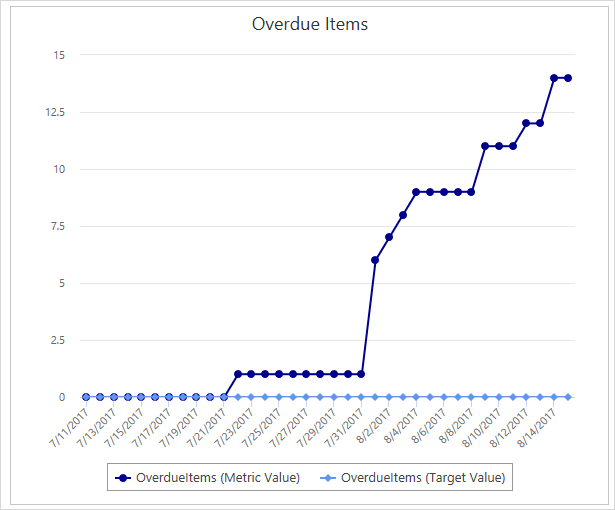
Metric History Chart
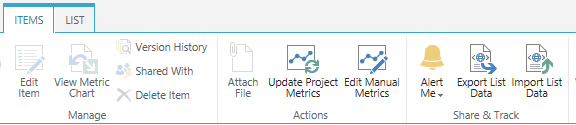
The Metrics list includes the ability to view the version history of a number metric in a chart. You can view the chart on a metric by metric basis by clicking View Metric Chart on the Metric Read form, or you view the histories of multiple metrics in the Metrics History Chart web part.
Single Metric
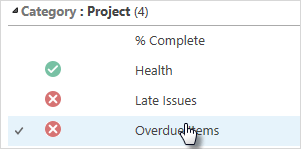
Every number metric has an associated History Chart that shows the historical progress of the metric. Click the Overdue Items metric to open it.
Click the View Metric Chart button.
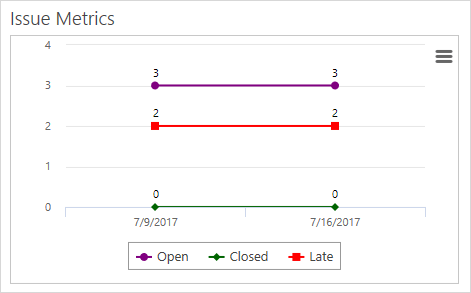
Metric History Chart Web Part
The Metrics History Chart web part displays the version history of up to four number metric items from the Metrics list in a configurable chart.
Click Project Home and then click the Status Charts tab.The line charts on this page use the Metrics History Chart web part. This web part can display the history of up to four different Number Metrics.
Suggested Exercise
Change the Planned Finish Date metric to a few days further ahead in time and recalculate the project metrics.
4. About Creating and Editing Metrics
In this section, you will learn about the form used to create and edit the various types of metrics.
Introduction
This section will provide a generic overview of the metrics form. As you now know, there are four different types of metrics. We will get you to create and update one of each type in subsequent exercises; however, it will be easier for you and will save time if we introduce the theory behind the Metrics form, as there are a lot of similarities with the four types.
To assist you with understanding this section, we recommend you have a New Metric form open and use the form to reference this section.
-
Navigate to the Project Standard site you created in the Create a Training Project Office guide – it should be named Hyper-V Deployment.
-
Click Metrics on the Quick Launch.
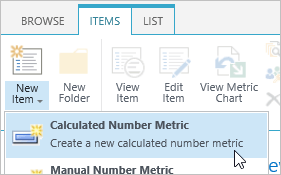
-
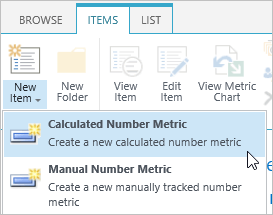
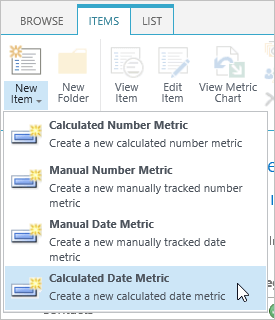
Click Items | New Item | Calculated Number Metric.
Scroll up and down the open form when you are reading this section and the subsequent sections.
The Metric form has 5 areas. Each area is explained in greater detail in the subsequent sections.
-
Metric Settings: This is where you define metadata like the Metric Title and Metric ID. This section of the form looks the same no matter what type of Metric is being created or edited.
-
Metric Value: This will vary depending on whether the metric is Manual or Calculated. If the metric is Manual, you will be able to enter the value into the Metric Number Value field. If the metric is Calculated, the field is not editable and is populated according to the criteria specified in the Metric Calculation Settings section.
-
Metric Calculation Settings: The Metric Calculation Settings section only appears for Calculated Metrics. In it, you specify the Metric Data Source and the Metric Calculation.
-
Metric Value Format: This is where you specify the display format of the metric. It will vary depending on whether the metric is a Number Metric or a Date Metric.
-
Metric Indicator Settings: This is an optional section where you define the value (a fixed number or date or another metric) that you want to compare the metric to and the associated warning and danger levels.
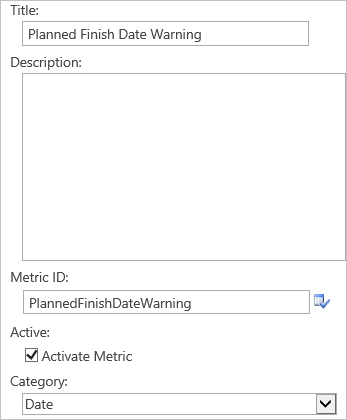
About Metrics Settings
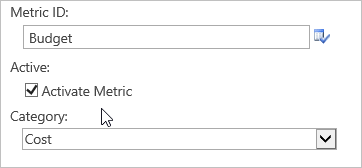
The Metric Settings section is where you define the metric title, description, metric ID, active status and category.
The most important thing to realize about this section is that the Metric ID must be unique. If you try to create a metric using an ID that is already in use, you will see an error message.
Making the Metric inactive does the following:
-
Prevents the data from this Metric appearing in reports.
-
Excludes the Metric from the Metric Recalculation Timer Job.
About Metric Value and Metric Calculation Settings
If the metric is a manual one, you simply enter the date or number for the metric. If the metric is calculated one, you have to define the source and the calculation that will be used to generate the metric.
The process of creating both a Calculated Date Metric and a Calculated Number Metric is quite similar so we will provide a high-level description of the concepts here.
Essentially, it is a two-step process:
-
Select Data Source
-
Select Metric Calculation
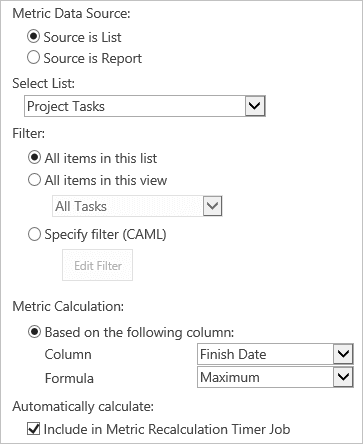
Select Data Source
The Data Source can either be a list or a BrightWork report.
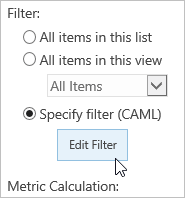
If the Data Source is a list, you can filter it with the following options:
-
All items in this list
-
All items in this view
-
Specify filter (CAML)
If the Data Source is a report, you can select a report from the BrightWork Server Gallery or the BrightWork Reporter Library with the option to select a report scope of Current Site or Current Site and Subs.
Select Metric Calculation
Once you have your metric data source defined, the next thing you need to do is define the metric calculation. You select a column in a list or a report and select a calculation to run against the column.
The available calculations depend on the metric type.
Number Metric
You have the following options:
-
Number of items returned (i.e. Count)
-
Based on the following columns (and Formula):
Average
Maximum
Minimum
Sum
If the Data Source is a report, you can select a report from the BrightWork Server Gallery or the BrightWork Reporter Library with the option to select a report scope of Current Site or Current Site and Subs.
Date Metric
You have the following options based on the following column (and Formula):
-
Maximum
-
Minimum
About Metric Value Format
The options available here will depend on whether the metric is a Date or a Number.
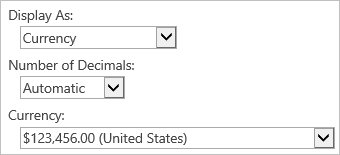
If the metric is a number, you will be able to render it as a number, a Percentage, a Currency, or specify a Custom number display format. You can also specify the number of decimals and the currency to be used if the Number metric is a Currency.
If the metric is a date, you will have the option of Date and Time, Date Only, or to specify a Custom date format.
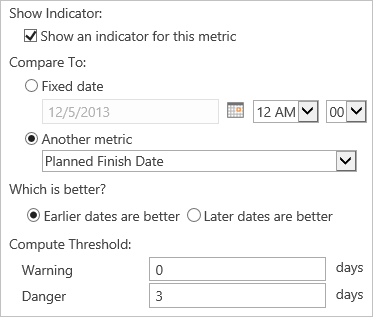
About Metric Indicator Settings
The Metric Indicator Settings section enables you to define Target, Warning and Danger ranges for the metric and to associate traffic light indicators with these ranges when the metric is compared to either a fixed target value or to a value in another metric.
Number Indicators
There are two types of Number Indicators:
-
Lower values are better
-
Higher Numbers are Better
When Lower values are better is selected, you can trigger a Warning or a Danger icon when the number returned by the metric exceeds the target (for example, you are over budget).
When Higher Numbers are Better is selected, you can trigger a Warning or a Danger icon when the number returned by the metric is lower than the target (for example, you are not meeting a sales target).
Note: When Lower values are better is selected, the Danger Level must be greater than or equal to the Warning Level and when the Higher values are better is selected, the Danger Level must be less than or equal to the Warning Level.
Currently, the Indicator Settings section does not support a scenario where, for example, you want to be warned the closer you come to a target running out of available resources.
Date Indicators
There are two types of Date Indicators:
-
Earlier dates are better
-
Later dates are better
When Earlier dates are better is selected, you can trigger a Warning or a Danger icon when the date returned by the metric exceeds the target (for example, you are late).
Note: With Date Metrics, the Danger Level must always be greater than or equal to the Warning Level.
5. Create New Metrics
In this section, you will learn how to create new metrics.
BrightWork Templates come preloaded with Metrics. However, a situation may arise where you want to create your own metric. This section will guide you through the various ways of creating a metric.
Create Manual Number Metric: Budget
Manual Number metrics are good for having static figures like budgets, team numbers, etc. For this exercise, we will give the project a fixed budget.
To create a Manual Number Metric:
-
Navigate to the Project Standard site you created in the Create a Training Project Office guide – it should be called Hyper-V Deployment.
-
Click Metrics on the Quick Launch.
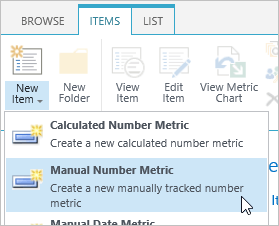
-
Click Items | New Item | Manual Number Metric.
-
Give the metric a title, e.g. Budget.
-
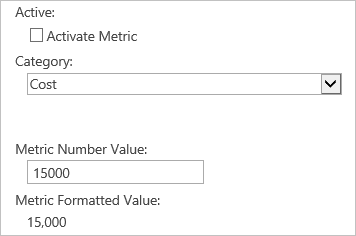
Deselect Activate Metric – we will reactivate it in a later step.
-
Select Cost as the Category and enter 15000 as the Metric Number Value.
-
Select Currency from the Display As menu.
-
Click Save.
Create Manual Date Metric: Internal Stop Date
Manual Date metrics would be useful in a situation where a hard stop date exists. In this scenario, we are going to imagine that the organization has an internal date by which the project must be finished by.
-
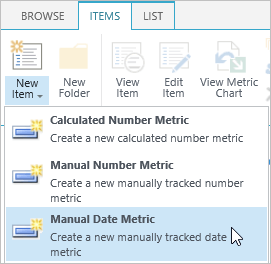
Click Items | New Item | Manual Date Metric.
-
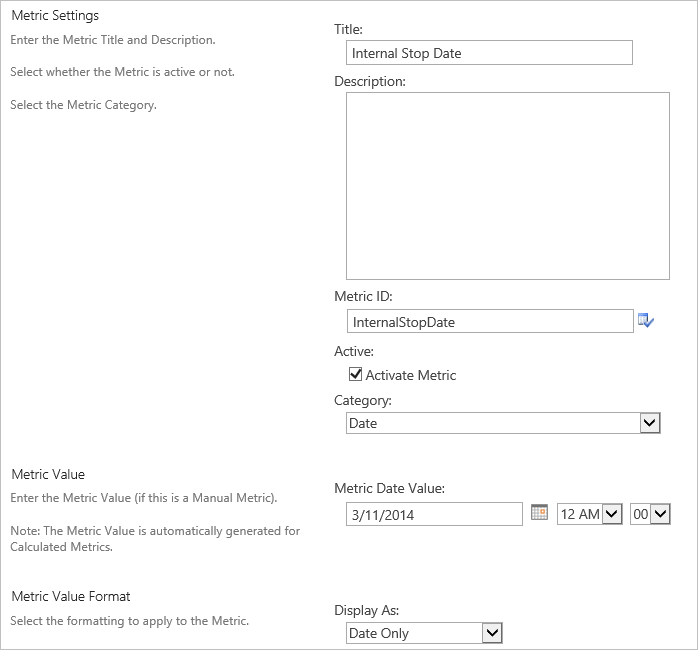
Give the Metric a Title, e.g. Internal Stop Date.
Note: The system will use the Title to automatically populate the Metric ID column, you can change this to something that makes more sense but it must be unique to the list. -
Select Date from the Category menu.
-
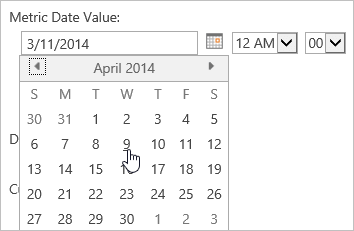
Specify the Metric value, e.g. a date three months into the future.
-
Leave Date Only selected in the Display As menu.
Note: See the Custom and Time Display Formats BrightWork help topic for more information on the Custom Date and Time Display Formats that you can use.
-
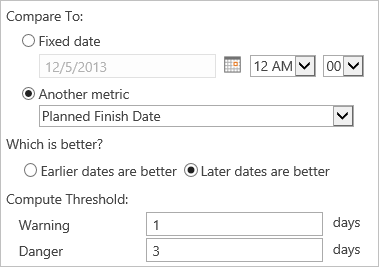
Select Another metric in the Compare to section.
-
Select Planned Finish Date.
-
Select Later dates are better.
-
Enter 1 in the Warning field and 3 in the Danger field.
Note: When the Planned Finish Date is one day past the date specified as the Internal Stop Date, the indicator will go yellow. When it is three days past, it will go red. -
Click Save.
Create Calculated Number Metric: Over Budget Warning
In this example you will create a Metric that warns you when the project total costs for the project are more than the allocated budget. You updated the Budget metric in a previous exercise.
To create the Over Budget Warning metric:
-
Click Items | New Item | Calculated Number Metric.
-
Give the Metric a Title, e.g. Over Budget Warning.
-
Select Cost from the Category menu.
-
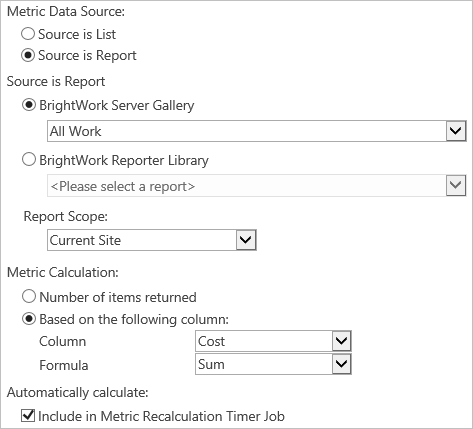
Select Source is Report then select the All Work report from the BrightWork Server Gallery menu.
-
Select Based on the following column and select the Cost column and the Sum formula.
-
Select Currency from the Display As menu.
-
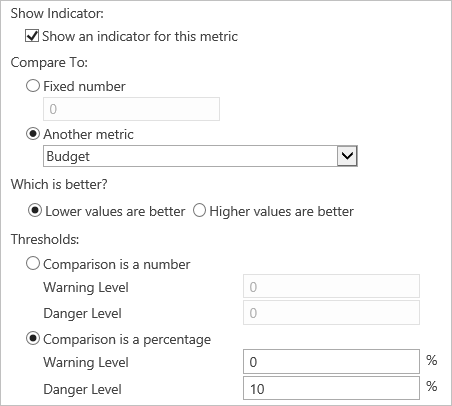
Leave Show and indicator for this metric selected.
-
Select Another metric and select the Budget metric you updated earlier.
-
Leave Lower values are better selected.
Note: This means that as long as the Metric you defined in the top section is lower than the Budget metric, you will get Green lights. -
Select Comparison is a percentage and enter 0 in the Warning Level field and 10 in the Danger Level field and click Save.
Note: This means that the moment you reach your budget allocation, you will get a Warning icon. If you go 10% over-budget, you will get a Danger icon.
If the Metric is Green, you are ok. If the Metric turns Red or Yellow, you are out of money! To remedy this you can increase the budget or reduce the costs.
Create a Calculated Date Metric: Planned Finish Date Warning
In this exercise we will get you to create a warning metric for the Planned Finish Date metric.
-
Click Items | New Item | Calculated Date Metric.
-
Give the Metric a Title, e.g. Planned Finish Date Warning.
-
Select Date from the Category menu.
-
Select Project Tasks from the Select List menu.
-
Select Finish Date and Maximum in the Metric Calculation section.
-
Scroll down to the Metric Indicator Setting section and select Another Metric and Planned Finish Date.
-
Leave the Warning at 0 and enter 3 into the Danger field.
-
Click Save.
Suggested Exercises
-
Create a Manual Date Metric for a major supplier release.
-
Create an Automated Metric to flag you when the date is past.
6. Configure Metrics
In this section, you will learn how to configure existing metrics so that they better serve your particular project management needs.
Update Manual Number Metric – Budget
One of the first things you will need to do when a project starts is to enter values for the manual metrics in your project.
To update the Budget metric:
-
Navigate to the Project Standard site you created when completing the Create a Project Office Training Guide.
-
Click Metrics on the Quick Launch.
-
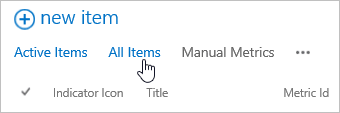
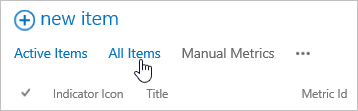
Select the All Items view.
-
Select No on the view filter on the Is Active column.Note: The Metrics list includes a number of inactive metrics. The Budget metric created earlier is inactive. Using the filter allows to quickly identify inactive metrics that you can activate.
-
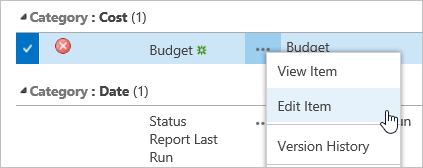
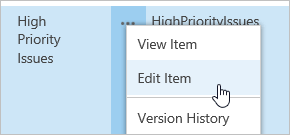
Click Edit Item on the Budget item menu.
-
Select Activate Metric.
-
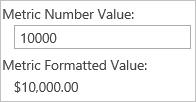
Enter 10000 in the Metric Number Value field.
-
Click Save.
Update Manual Date Metric – Internal Stop Date
To update the Internal Stop Date:
-
Click Metrics on the Quick Launch and open the Internal Stop Date metric for editing.
-
Click the calendar icon and select a date in the future.
-
Click Save.
Update a Calculated Number Metric from a list using CAML
When you use a list as the Metric Data Source, you can select a view to filter the items in the list. While this makes it very easy to configure the filter for the items in the list, it also means that there is a risk that someone else could edit the view and adversely affect the Metric.
A more secure way to filter the list is using CAML, as this is less likely to be edited by another person. Do not worry if you are unfamiliar with CAML, in this exercise we will just get you to edit the existing CAML in a metrics item.
Note: Collaborative Application Markup Language (CAML) is an XML-based language that is used in Microsoft SharePoint to define the fields and views that are used in sites and lists. See the Introduction to Collaborative Application Markup Language (CAML) MSDN article for more information.
-
Click Metrics on the Quick Launch.
-
Select the All Items view.

-
Open the High Priority Issues metric for editing.
-
Scroll down to the Metric Calculation Setting section and click Edit Filter.
-
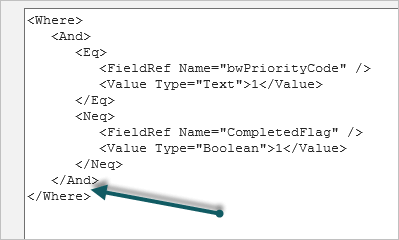
A Text Editor will open with some CAML code in it. Insert the code at the position indicated below:
-
Copy and paste the below code in the marked square:
< And >
< Eq >
< FieldRef Name=”DateDue”/>
< Value Type=”DateTime”> < Today/>< /Value>
< /Eq>
< /And>
Note: The effect of this change is to make the High Priority Issues list only show Issues due today.
-
Click OK.
-
Click Save.
Suggested Exercise
Change the Risk indicator calculation to measure the combined count of high priority and late issues. Turn the indicator yellow if this number is greater than 3 and red if it is greater than 5.
7. Configure Metrics Scorecard
In this section, you will learn how to configure an existing metrics scorecard and how to add a new one and set it up from scratch.
Introduction
The Metric Scorecard web part enables you to display the history of multiple metric items from a specified Metric list in the same site.
This web part has been added to the Dashboard tab on the Project Lite, Project Standard, Project Structured, and Project Office templates.
Click Status Charts on your project home page. The Metric Scorecard is displayed at the top of the page.

Change the Interval and Formula
By default, the Metric Scorecard web part is configured to show what state the selected metric indicators were at the end of the month.
-
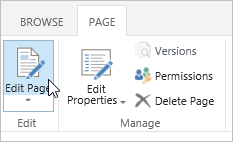
Click Page | Edit Page.

-
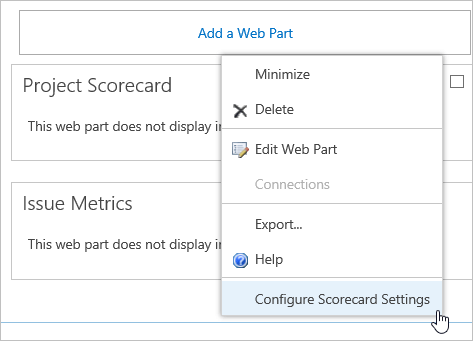
Click Configure Scorecard Settings on the web part menu.
-
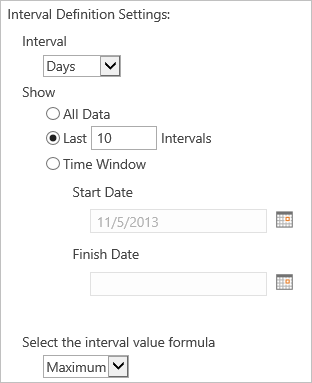
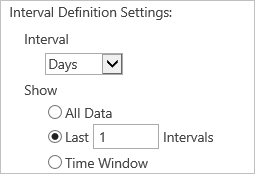
Select Days from the Interval menu.
-
Select Last in the Show section and enter 10 in the box.
-
Select Maximum from the interval value formula menu.
-
Click OK.
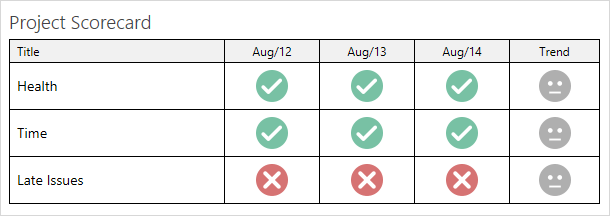
The Project Scorecard should now look something like the below.
Add a Metrics Scorecard with Values
The default Metric Scorecard focuses on the indicator status and that is very necessary; however, you can also set up the web part to display just values.
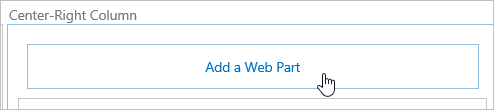
-
Click Add a Web Part.
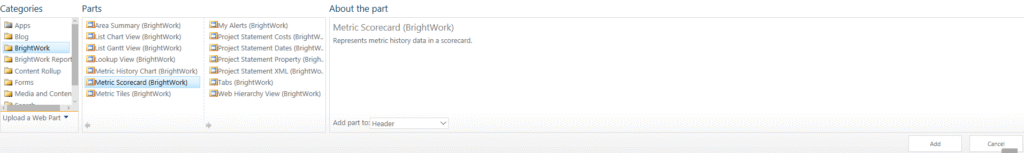
-
Select BrightWork and Metrics Scorecard (BrightWork), and click Add.
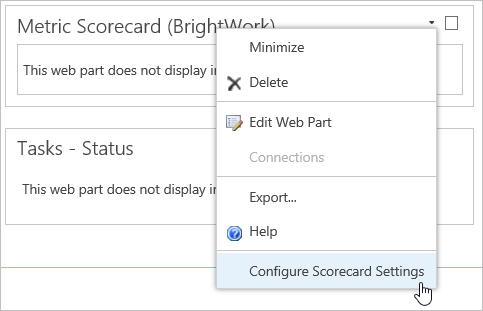
-
Click Configure Scorecard Settings.
-
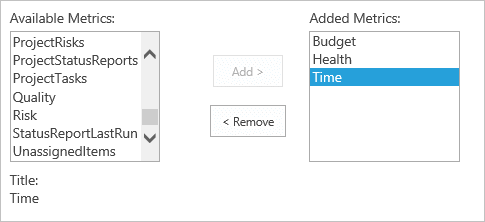
Select the Project Metrics list.
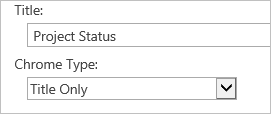
-
Expand Web Part Settings and enter Project Status in the Title field and select Title Only from the Chrome Type menu.
-
Add Budget, Time, and Health metrics.
-
Select Days from the Interval Menu and set it to show the last 1 interval.
-
Scroll down to the Scorecard Appearance section and choose one of the preset themes.
-
Click OK to view the configured scorecard.
Suggested Exercise
Add an instance of the Metrics Scorecard web part that displays information about work in the project.
8. Reusing Metrics
The Metrics list cannot be saved as a list template. Use this method to reuse metrics.
Export and Import Metrics
Exporting metrics generates the metrics for your project as an XML file that you can then later use to import into a project based on that template.
-
Click Site Contents.
-
Click the Project Metrics app.

-
Click Items | Export List Data.
-
Save the XML file to your computer.
Note: When importing metrics, it is important to note that you import on a like-for-like basis, ie. Metrics from a Project Standard template should only be imported into a Project Standard project.
When importing a metrics list back into a project, the older metrics will need to be deleted as otherwise conflicts will occur. -
Click Site Contents.
-
Click the Project Metrics app.
-
Select the All items view.
-
Click the Select All icon.
-
Click Items | Delete Item.
-
Click OK.
-
Click Items | Import List Data.
-
Browse to the location of the Metrics file you wish to import.
-
Click Import.
Looking for templates on Microsoft 365?
BrightWork 365 lets you plan, manage, and collaborate in Microsoft 365.