Senior Executive
In this training guide you will learn about the cross-project reporting features available with BrightWork. This guide is aimed mainly at Senior Executives and Program Managers who need to maintain oversight of work and projects in the organization.
1. Getting Started
Prerequisites
If you are new to SharePoint and BrightWork, we recommend that you first complete the Team Member Training Guide.
If you need to be more directly involved in managing projects, we recommend that you complete the Project Manager Training Guide before using this guide.
System Requirements
Microsoft SharePoint 2013 is compatible with Internet Explorer 8 or later. Click here to download the latest version of IE.
Other browsers like Mozilla Firefox or Google Chrome are supported, but may have reduced functionality.
IE 10 users should add their BrightWork site to their Compatibility View list. For more information, see the Setup Your Browser BrightWork help post.
Suggested Exercises
At the end of many chapters, you will see some Suggested Exercises that you should be able to complete on your own, based on what you have just done.
These suggested exercises will not contain any steps – you will need to apply what you have learned to do the exercise.
We strongly recommend you complete these suggested exercises, as they will help to reinforce what you have just learned.
2. Cross Project Reporting
In this section you will learn about the different report types available in BrightWork. Project sites include a number of cross-list and cross-site report types that can be used across a range of scenarios.
Report Types
BrightWork Reports can read data from multiple lists in multiple sites and display results in a variety of ways.
There are four basic cross-project report types:
-
Chart
-
Gantt
-
List Item
-
Resource Usage
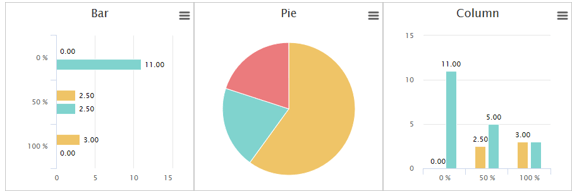
Chart Reports
Chart Reports display data from lists in visual reports such as Pie, Bar, 3D, and Polar. You can easily zoom, print and download charts.
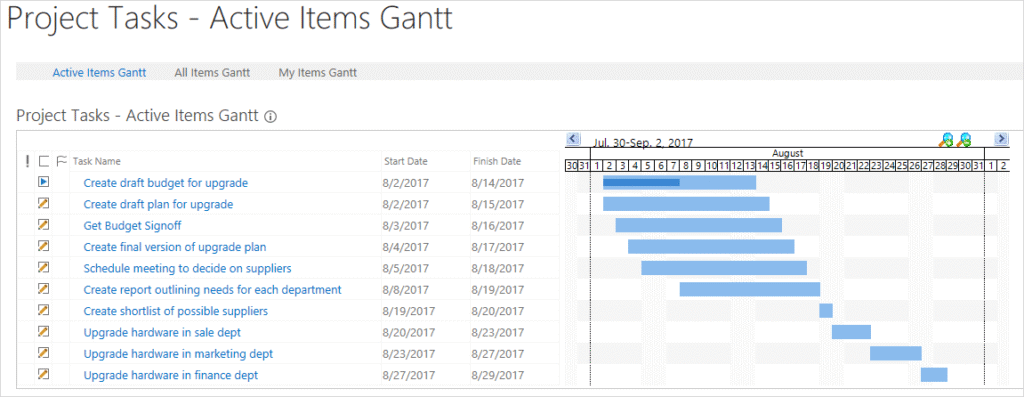
Gantt Reports
A Gantt chart provides a graphical illustration of items in a schedule that helps to plan, coordinate, and track specific tasks in a project.
List Item Reports
A BrightWork list item report is similar to a SharePoint view, except, like all BrightWork reports, it can show data from multiple lists in multiple sites.
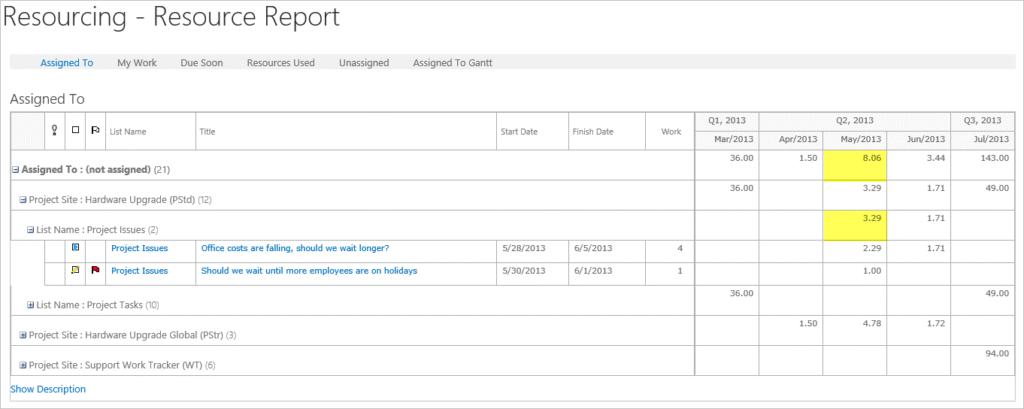
Resource Reports
Resource Usage reports display how much work has been assigned and allocated in a calender-like view. The report shows the hours allocated to a particular item and to the grouping(s) (e.g. Assigned To, Role, List Name, Project, etc) selected on the reporter settings page.
Project Management Reports
BrightWork templates include a series of reports that show data from multiple lists and projects. Some reports are displayed on the project or project office home page; however, the majority of reports are accessed from the Quick Launch. The various reporting dashboards are described below. You should take some time to explore the way the data in these projects report up to these dashboards.
Note: Cross-project reports can use the Project Cache or the Work Cache to improve performance when reporting over a large number of project sites.
See About the Project Cache for more details about using the project cache in BrightWork.
See About the Work Cache for more details about using the work cache in BrightWork.
Project
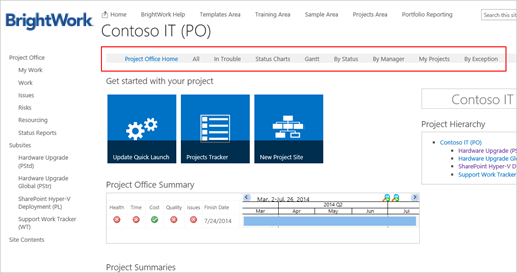
The Project reports, available from the tabs on site home pages (highlighted below), display high-level information about the project(s). If your focus is on high-level detail, these are the reports you will most likely be interested in.
-
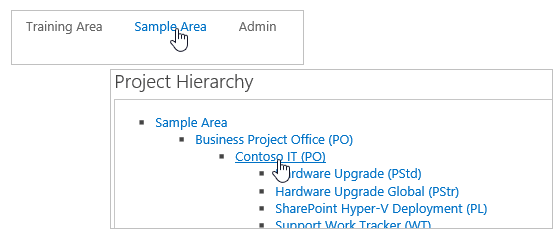
Click Sample Area on the Top Link bar and then Contoso IT (PO) on the Project Hierarchy web part.

-
Explore the various reporting dashboards available from the tabs on the site home page.
My Work
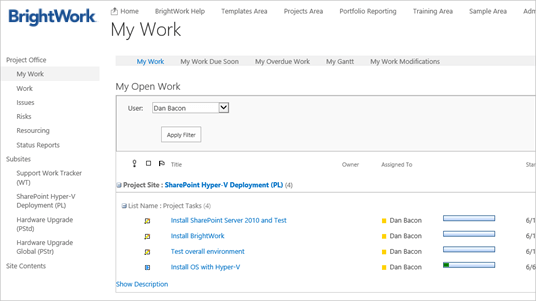
Click My Work on the Quick Launch. The My Work reports display various reports relating to the items assigned to the logged in user.
They also allow the selection of another user from a drop-down menu. If you need to focus on the performance or workload of an individual employee or team member, this is a useful report.
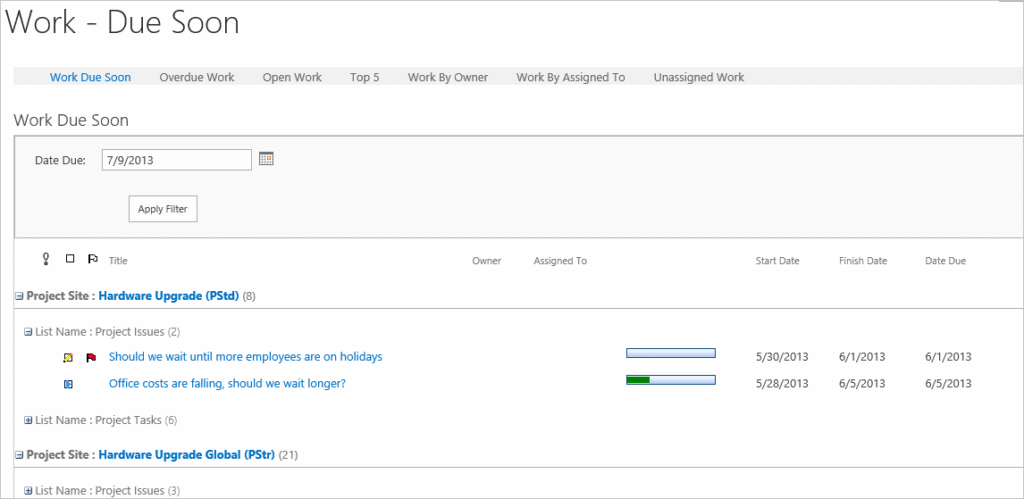
Work
Click Work on the Quick Launch. The Work Reports display information about all the work items in the projects.
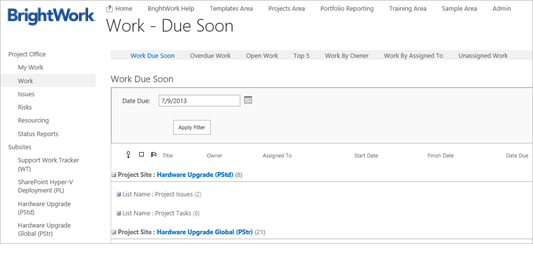
As a senior manager, you will probably be interested in the Overdue Work report and the Unassigned Work report! These two reports enable you to see what work is late and what work is not being focused on.
Issues
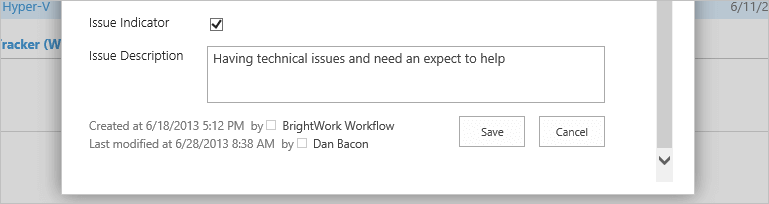
The Issues Reports display all the items created with the Issues list and all the items in other lists that have had their Issue Indicator checkbox selected.
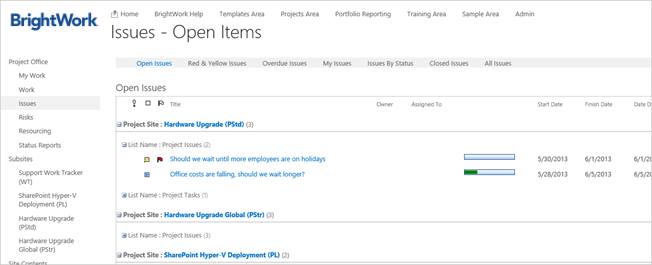
All work items have an Issue Indicator checkbox and an Issue Description field. This enables team members to let management know that there is an issue with one of their work items.
Resourcing
The Resourcing reports display information about the availability of Project Team members. When team members are over-allocated, the impacted time-period is highlighted on the report.

Note: Resource reports are not available on the loosely structured templates such as Project Lite because work effort is not tracked at a task level.
3. Personal Project Reporting
In this exercise, you will create and work with a personal report. As you’re likely now aware, BrightWork comes with an extensive set of cross-project reports. These reports are setup in a generic way. As a senior manager, you will no doubt have your own specific reporting needs.
Create a Personal Report
As you have just seen, BrightWork includes a large number of reports that enable you to get a good understanding of what is going on in all projects in your organization.
BrightWork also allows you to create a personal report that suits your needs better. You can toggle back to the default shared report as needs be.
-
Click Sample Area on the Top Link bar and then Contoso IT (PO) on the Project Hierarchy web part.
-
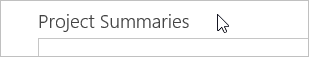
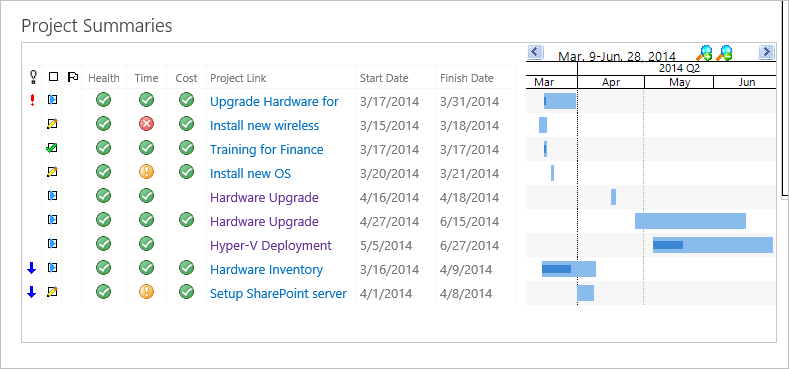
Click the Project Summaries report header on the Project Office home page.Clicking the report header is how to make the Reporter Tools ribbon appear for a BrightWork report.
-
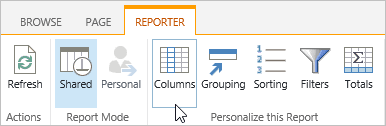
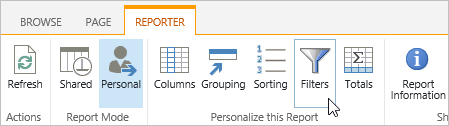
Click the Reporter tab.
-
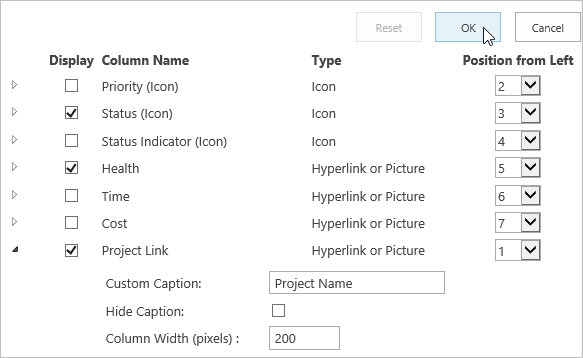
Click the Columns button in the Personalize this Report section.
-
Unselect Priority (Icon), Status Indicator (Icon), Time, and Cost.
-
Select 1 from the Position from Left menu for the Project Link column and change the column width to 200. Give the column a custom caption, e.g. Project Name, and click OK.
The personal report should now look something like the below.
-
Click the Filters button.
-
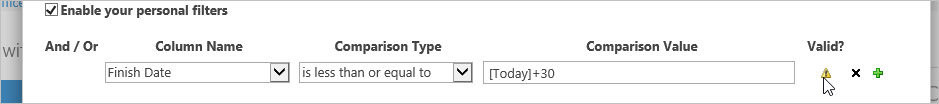
Select Finish Date and is less than or equal to and enter [Today]+30.
Note the Alert under Valid? This indicates that there is something wrong with the syntax in the filter.
-
Mouseover the Alert symbol to get a possible explanation.As you can probably see, the comparison value should be [Today+30].
-
Enter [Today+30] in the Comparison Value field.
-
Click OK.
Now you should have a personal report that focuses on projects due to finish in the next 30 days!
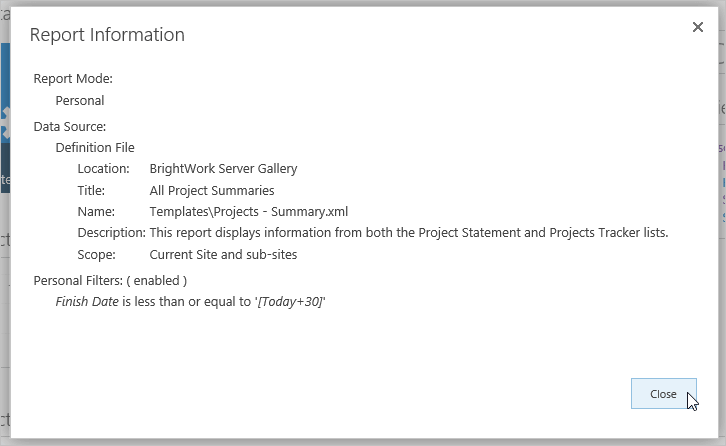
View Report Information
In the last exercise, you altered your report to see only those projects that are due to finish in the next 30 days. If you make changes to a variety of reports, it can be useful to see what filtering you have applied or what data source the report uses. The Report Information Window allows you to see all this information at a glance.
-
Click in the header of the Project Summaries report to expose the Reporter ribbon.

-
Click the Report Information icon.
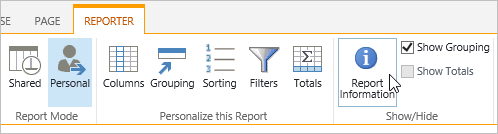
The Report Information window that appears shows you whether the report is Personal or Shared, which data source it uses and what filters have been applied.
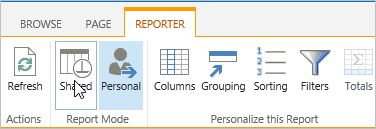
Toggle between a Personal and Shared Report
It is very important to remember that the personal report is the report that will load first whenever you visit the page. There will be no indication of this when you land on the page. You can tell whether the report is a personal or a shared one by clicking on the report header to expose the Reporter Tools ribbon. If the displayed report is a personal one, the Personal button will be highlighted. You can also click the Report Information icon to see more details about the report, including whether it is Shared or Personal.

Click the Shared button to toggle back to the original shared version.
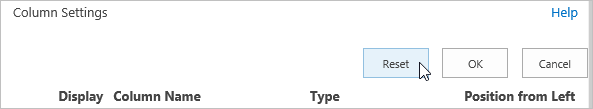
Reset a Personal Report
You can reset a personal report back to its default state by clearing your personal settings.
-
Click Columns in the Personalize this Report section.
-
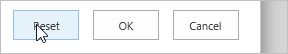
Click Reset.
-
Click OK to confirm.
-
Click the Filters button in the Personalize this Report section.
-
Click the Reset button.
-
Click OK to confirm and the report will now default back to the Shared version.
Note: For an alternative method to quickly clear your personal report settings and default back to the shared report, see this Help article.
Suggested Exercise
Think about your actual personal reporting needs, and select and personalize a report accordingly.
4. Share Reports
In this section, you will learn how to email a report and how to setup an Excel report that is refreshed from a web query. You can share BrightWork reports in various ways, including print, email and Microsoft Excel.
Email a Report
You may need to contact a team member regarding their My Work report or you may need to send information higher up the chain.
Note: Reports can only be emailed to email addresses that exist in the active directory or list of users added to the site collection.
-
Click Work on the Projects Office Quick Launch.
-
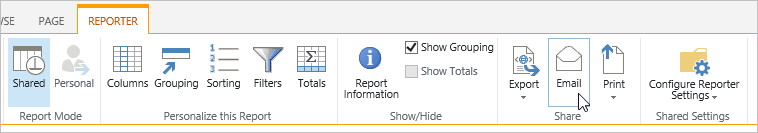
Click in the Work Due Soon report header to activate the Reporter Tools ribbon.
-
Click Reporter | Email.
-
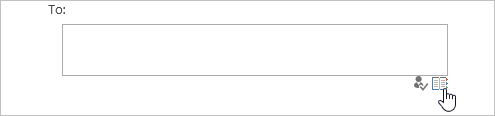
Click the Browse button.
-
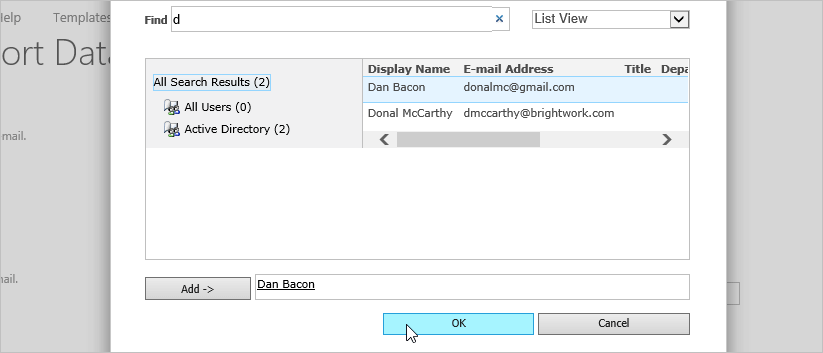
Enter the first letter of your name and click Enter on your keyboard.
-
Double-click on your name and click OK.
-
Enter a Subject and a message.
-
Click Send.You should shortly receive an email like the one below in your inbox.
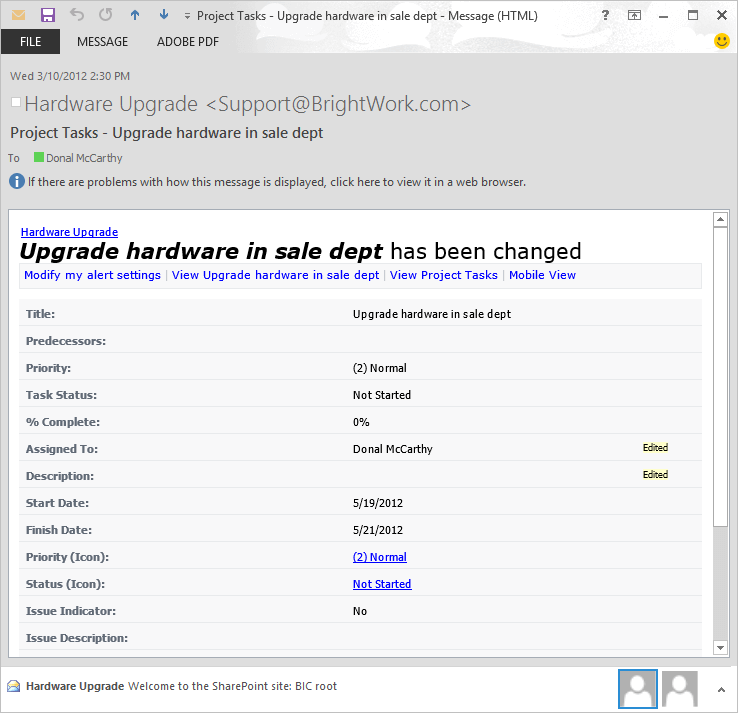
Note: As well as being able to email reports on demand, you can also setup reports to email on a schedule (e.g. every Monday morning). You can even set reports with user filters (e.g. My Work) to email each user about their assigned items. To learn more, read this Help article.
Print a Report
Need to rush to a meeting without your laptop? Just print the relevant report.
-
Click in the Work Due Soon report header to activate the Reporter Tools ribbon.
-
Click the Print button in the Share section of the Reporter Tools ribbon.
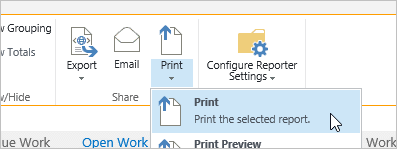
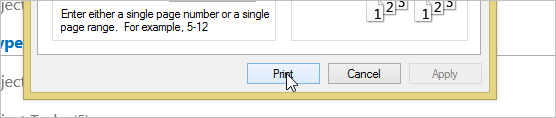
-
Ensure you have the correct printer selected and click Print.
Export a Report to Static Excel
Many managers live and breathe with Microsoft Excel. Fortunately, you can export BrightWork reports to Static Excel.
-
Click in the Work Due Soon report header to activate the Reporter Tools ribbon.
-
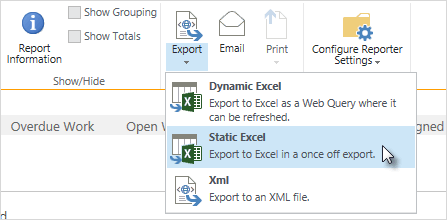
Click Export | Static Excel on the Reporter Tools ribbon.
-
Click Open.

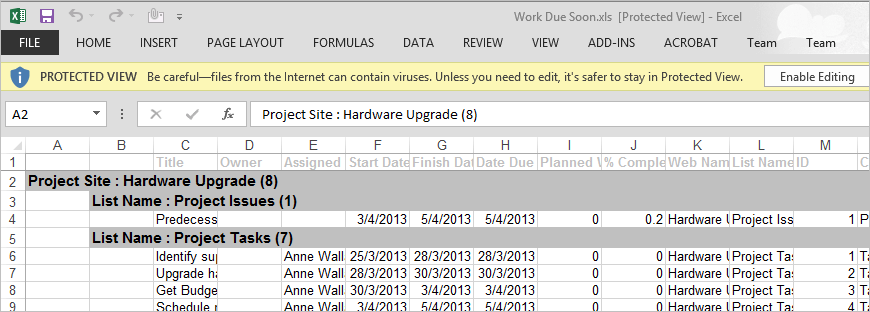
-
Click Yes.
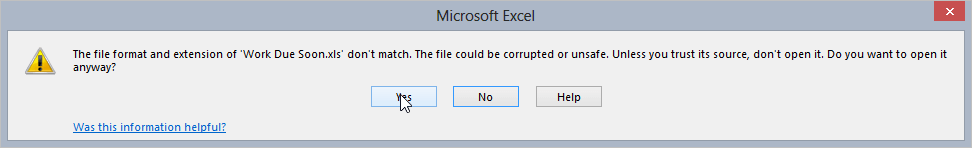
The Excel file will open.
Export a Report to Dynamic Excel
BrightWork also enables you to create a web query that establishes a refreshable data connection with a selected report that will update every time you open the Excel file. This means you can do things like combine live data from BrightWork with data from other sources and use Dynamic Excel to analyze this data.
-
Click in the Open Work report header and then the Reporter tab to activate the Reporter ribbon.
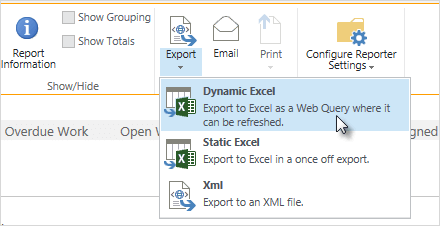
-
Click Export | Dynamic Excel.
-
Click Open.

-
Click Enable.
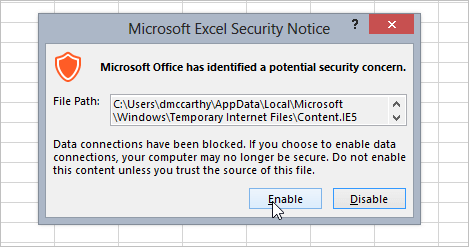
-
Enter your Username and Password and click OK.
-
Click Data | Properties and select Refresh data when opening the file.
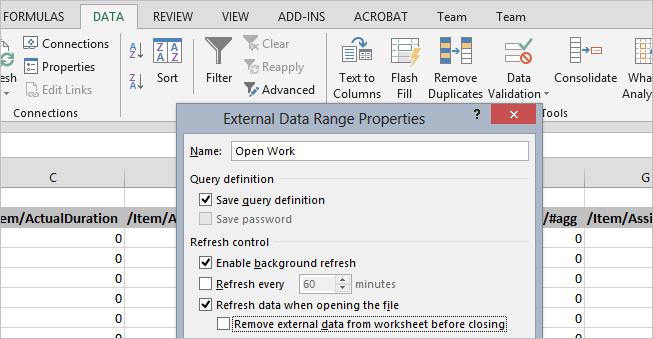
-
Click OK.
-
Save and close the file to a suitable location.Now, whenever you open this file, it will automatically update with the latest information from the report.
Note: Reporter Tools filters, like you added previously, are not supported when exporting report data – all the data returned by the uncustomized report will be exported.
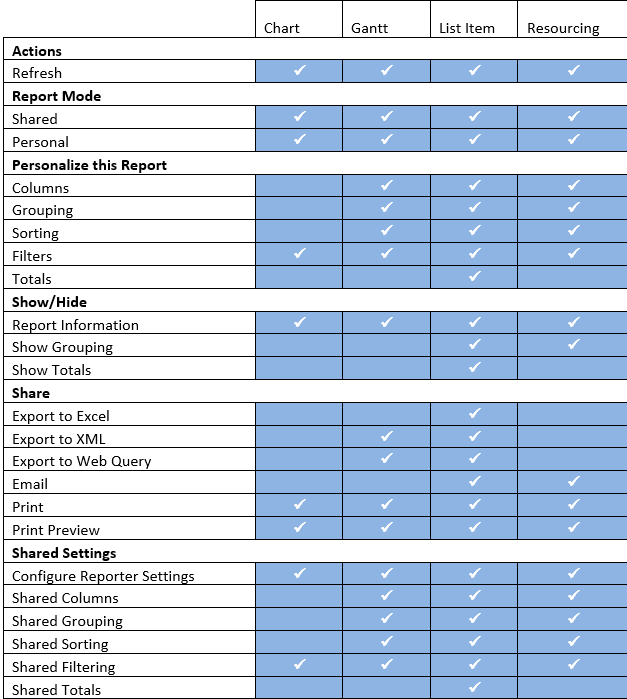
Reporter Tools Sharing and Configuration Options
The table below displays the options that are available from the Reporter Tools ribbon for each report type.
Suggested Exercise
Use the reporter toolbar to print a report.
5. Portfolio Reporting
In this section, you will learn how to create reporting portfolios and how to add sites to these portfolios.
Introduction
In BrightWork, a portfolio is a custom grouping of projects from all across the BrightWork site collection, brought together for reporting purposes. These groupings of projects reside in the Portfolios Area. The Portfolio template contains the same reports as the Project Office template.
To understand the significance of this, click Sample Area on the Top Link bar and click on some of the Report links in the Quick Launch. You will notice that all the reports contain data from all the sites under the project office. The bottom-up, hierarchical reporting, is fine for this scenario; however, imagine a scenario with many project offices and many sites.
You may have a need to only report on a specific selection of projects spread across the hierarchy. To report on these sites you could add them to a Portfolio.
Create a Portfolio
To create a Portfolio:
-
Click Portfolios Reporting on the Top Link bar.
-
Click Settings | Create Portfolio.
-
Give the Portfolio a Title – we suggest using your name and/ or initials.
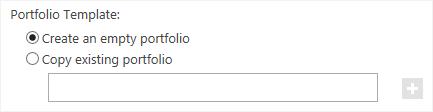
Note: The URL name field automatically populates based on the Title you enter. -
Leave Create an empty portfolio selected to use the Project Office Portfolio template.
-
Click Create.
Add Sites to Your Portfolio
-
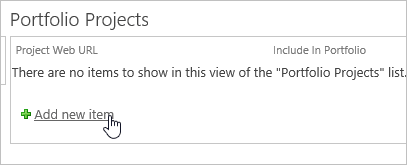
Click Add new item on the Portfolio Projects web part.
-
Click Browse.
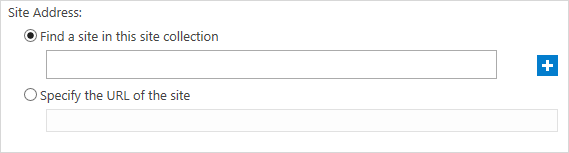
-
Hit Return on your keyboard.
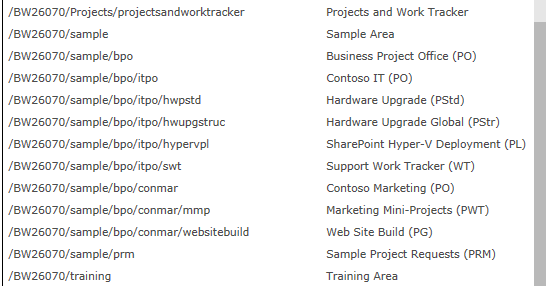
-
Select the Business Project Office (PO) site and click OK.
-
Click OK again.
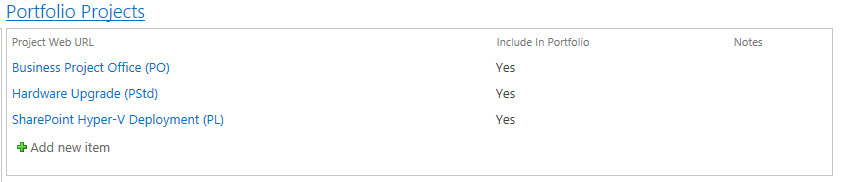
-
Click Add new item and add the Hardware Upgrade (PStd) and SharePoint Hyper-V Deployment (PL) sites to your Portfolio. You will see that the portfolio now reports on the sites you added to it.
Note: Portfolios also allow you to add a Project Office to a portfolio and have all its subsites appear in the portfolio reports without having to add them individually. Any subsites subsequently added to the Project Office will automatically appear in the Portfolio.
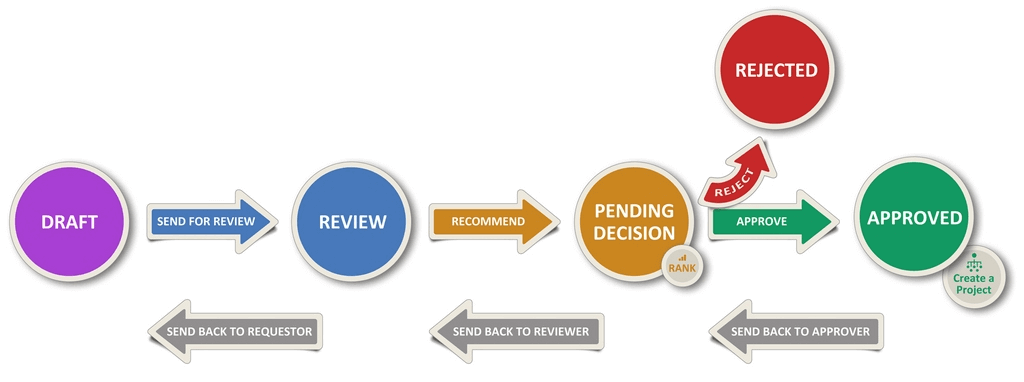
6. Manage Project Requests
In the following exercise, you will get an overview of the Project Requests feature. You will navigate through an existing example and see where to log, review, rank and approve/reject project requests. You will also see an option to create new project sites from approved project requests.
Manage Project Requests
-
Click Sample Area.

-
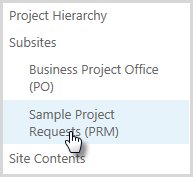
Click Sample Project Requests (PRM) on the Quick Launch to see some project requests and if you wish create your own.
-
Click Log a Request. Here you, or anyone with permission, can create a request for a new project.
-
Click Review Requests. This view contains project requests assigned to you for review. If there are no requests here, it is likely because only requests sent to you for review will be in this view.

-
Click Requests Home to return to the homepage.
-
Click Rank Requests, which allows you to rank project requests that are awaiting approval. These requests have a status called ‘Pending Decision’. Click OK when finished.
-
Click Approve Requests, which opens a view of those pending decision that you can approve or reject.
-
Click Requests Home to return to the homepage.
-
Click Create Projects. This option allows you to create a project from an approved project request.
-
Click Requests Home to return to the homepage.
-
To see some of the reports possible, click on the Status Summary link on the homepage. This page uses various charts to show the overall status of the project requests in this site.
Suggested Exercises
To learn more about how to log, review, rank, approve/reject project requests and create projects from them, please read through the Project Request Manager training guide.
Looking for templates on Microsoft 365?
BrightWork 365 lets you plan, manage, and collaborate in Microsoft 365.