Working with Report Data Sources
The purpose of this guide is to introduce you to Reporter Data Sources and to working with Reporter Definitions.
Sections:
1. Introduction
In this training guide you will learn about working with Reporter Definitions so you can do things like report on the columns and lists you added to your templates. You will also learn how to add filters to reports, add metrics to reports and improve report performance.
Prerequisites
You will need to have completed the following guides:
- Create a BrightWork Training Office in the Introductory Guide
- Project Metrics List Training Guide
- Working with Lists and Libraries
- Configuring BrightWork Reporter
If it has been a while since you completed these guides, you should review them again so you can remember the changes you made to your training environment, as you will be building on those changes in this guide.
We also suggest you read through the Report Editor Training Scenarios BrightWork Help topic to get a high-level overview of using the Report Editor to edit Reporter Definitions.
Suggested Exercises
At the end of many chapters you will see some Suggested Exercises that you should be able to complete on your own, based on what you have just done.
These suggested exercises will not contain any steps – you will need to apply what you have learned to do the exercise.
We strongly recommend you complete these suggested exercises, as they will help to reinforce what you have just learned.
2. About Report Data Sources
A Report Data source defines the columns available to be reported on for the end user. Every BrightWork Report is driven by one of three data sources: a Reporter Definition, the Project Cache, or the Work Cache.
The majority of this guide is devoted to working with Reporter Definitions.
About Reporter Definitions
Most BrightWork Reports are driven by Reporter Definitions. A Reporter Definition is an XML file that includes the basic structure for a report. The XML files are stored on the server or in the BrightWork Reporter document library in your site collection. BrightWork includes an interface called the Report Editor for editing the XML in the Reporter Definitions.
BrightWork ships with many Reporter Definitions – see the Supplied Reports topic in the BrightWork Help for a description of all the Reporter Definitions supplied with BrightWork.
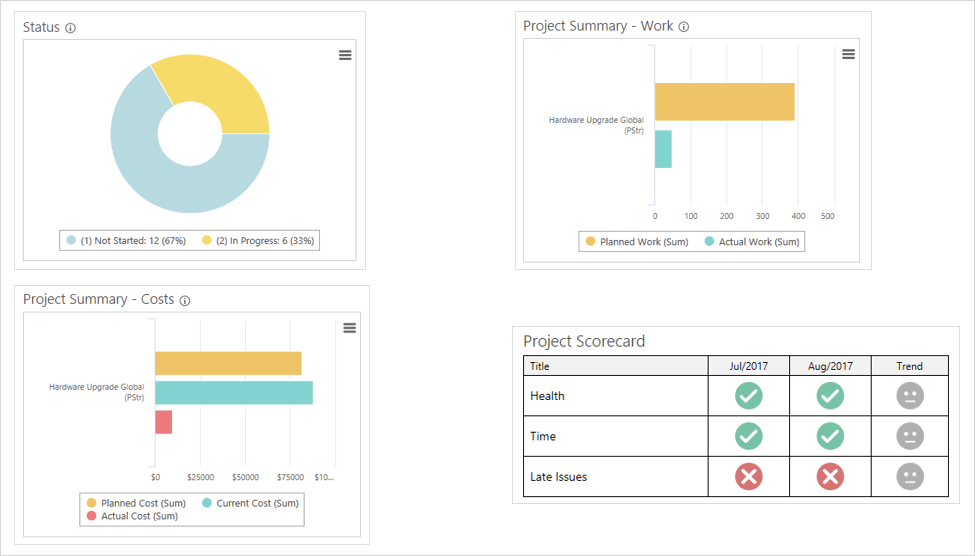
The flexibility of BrightWork Reporter means that a single Reporter Definition can result in many different reports, for example, four of the reports shown below are driven by a Reporter Definition called All Project Summaries (the Project Office Scorecard is driven by the Metrics list).

The Reporter Definitions that ship with BrightWork are stored on the server. You will not edit these as it means they would be edited for all users and you would also run the risk of losing your updates when you next upgraded BrightWork.
The Reporter Definitions you edit are generally stored in the BrightWork Reporter library. This library is located at the top of every BrightWork site collection, in the site collection home site. The BrightWork Reporter library has the ability to create a copy of any report on the server or in the library. It also gives you the ability to start from a blank report.
The BrightWork Reporter Library includes the Report Editor that you use for editing the Reporter Definitions you add to the library. The Report Editor enables you to make code changes to a Reporter Definition in the BrightWork Reporter Library without having to touch any of the XML code that defines the Reporter Definition. You can do things like: add columns to reports, add and/or update lists being reported on, edit site filters etc., all without having to edit a single line of XML.
Note: Editing the XML can be useful in edge cases, such as modifying a large number of reports at once. For more information, see the Report XML Reference Guide BrightWork help topic.
About the Project Cache
The Project Cache is a hidden list to which all changes in the various Project Statements, Projects Tracker and Project Metrics lists in all Project and Project Office sites in the site collection are written. This means that BrightWork Reporter only has to query a single list to generate the report, instead of querying multiple lists in multiple sites.
Note: As each BrightWork site collection only contains one Project Cache, for best practice reasons, it will not be possible to use your site collection for training with the Project Cache.
For more information on the Project Cache see the BrightWork help and the below webcast link.
The About the Project Cache training webcast includes information on the following:
- Why and when to cache a report
- Locating the project cache
- Adding entries to the project cache
Also, see the Project Cache topics in the BrightWork help for more information on the same topics.
About the Work Cache
The Work Cache data source is designed as an alternative to work and issue reports that report across multiple sites. Due to its cached nature, the associated reports will generally render faster on end user web pages because BrightWork Reporter only has to query a single list to generate the report, instead of querying multiple lists in multiple sites.The Work Cache reports across the following lists: Tasks, Issues, Goals, Risks, Project Change Requests as well as Project Requests. The Work Cache is a hidden list where all changes made to the lists mentioned in the site collection are written.
Note: As each BrightWork site collection only contains one Work Cache, for best practice reasons, it will not be possible to use your site collection for training with the Work Cache.
To find out more about the Work Cache, see the following BrightWork help topic.
About the Project Status Report Cache
The Project Status Report Cache report data source is designed as an alternative to reports that report across multiple open project sites. The Project Status Report Cache provides faster cross-site reporting.
See the Project Status Report Cache topic in BrightWork Help for more information.
3. Create Copy of a Reporter Definition
In this section, you will learn how to create a copy of a Reporter Definition that you can customize for your own needs.
Create Copy of a Reporter Definition
The majority of custom reports you make will likely be variations on an existing Reporter Definition. This is why you should use an existing Reporter Definitions as a starting point when creating a new Reporter Definition.
See the Supplied Reports BrightWork help topic for a brief description of the Reporter Definitions supplied with BrightWork.
- Navigate to your Project Office home page and ctrl-click on Home to open the site collection home page in a new browser tab.
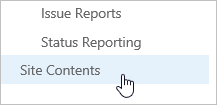
- Click Settings | Site contents on the site collection home page.

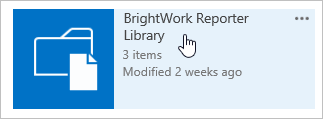
- Click BrightWork Reporter Library.

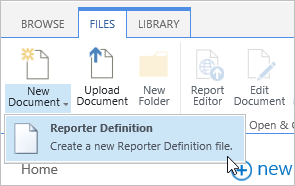
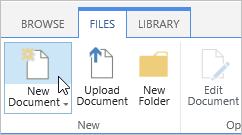
- Click Files | New Document | Reporter Definition.

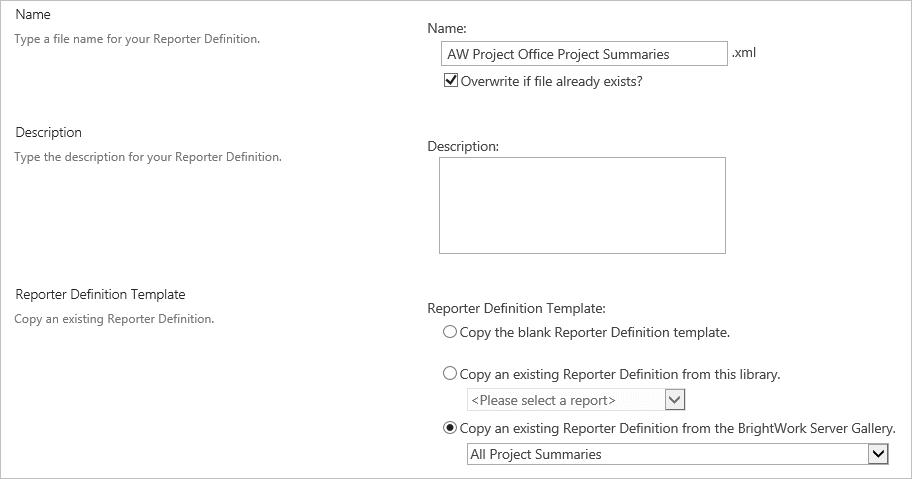
- Give the Reporter Definition a name that will allow you to distinguish it from the other custom reports (for example, Your Project Office Name; Project Summaries).
Note: Please use your name or some other unique identifier in the name of the Reporter Definition. This will make it easier for you to identify the report if you are taking the training in a shared environment. - Select Copy an existing Reporter Definition from the BrightWork Server Gallery.
- Select the All Project Summaries Reporter Definition.

- Click Create.
- Repeat the processes and create a copy of the Open Work report.

Note: Sometimes it is useful to use reports in multiple locations. To monitor where these reports are being used, you can use the Report Locations feature. For more information, please see the Report Locations BrightWork help topic.
4. Add Columns to Reporter Definitions
In this section, you will learn how to add columns to a Reporter Definition, map columns, create new pages for reporting and configure reports to display mapped list data. You will also add report tabs, configure charts and add site filters to your Reporter Definition.
Add Column to Reporter Definition
In this section, you will add the Region site column you added to the Project Statement in the ‘Working with Lists and Libraries’ guide to the copy of the project summary report you just created. You will need to know the Internal Column Name you gave this column.
You will also configure an instance of the Reporter web part to use this report and column.
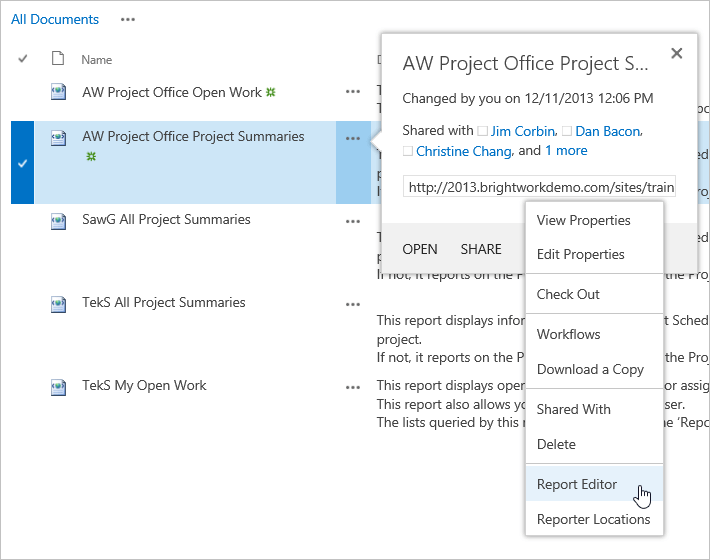
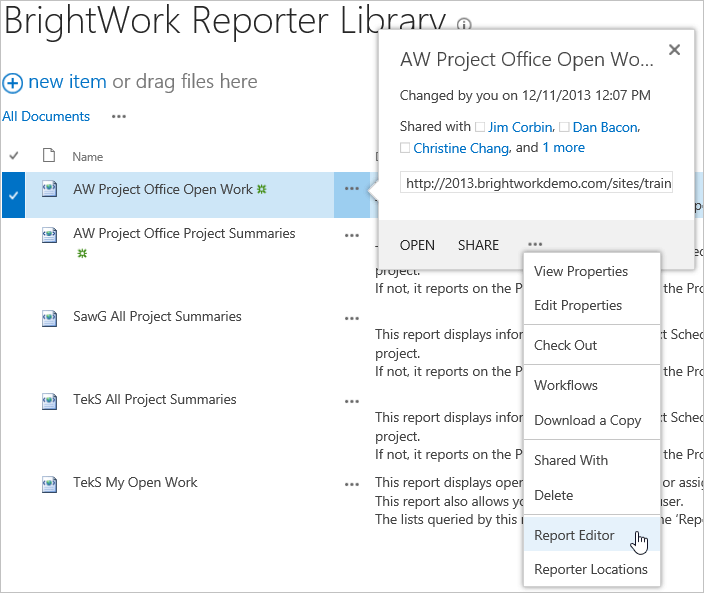
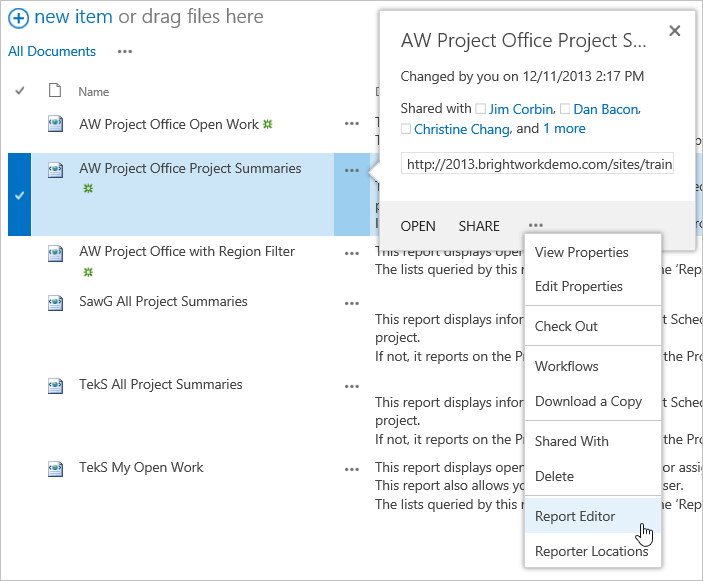
- Click Report Editor on the menu of the Project Summaries report you just created.

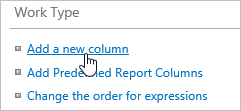
- Scroll down and click Add a new column.

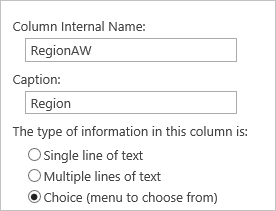
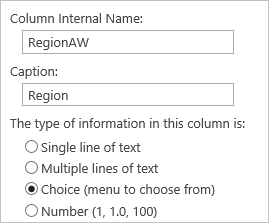
- Enter the internal name (not the friendly, display name) you previously gave the column in the Column Internal Name field.
See the Identify the Internal SharePoint Column Name BrightWork help topic for some tips on identifying the internal column name. - Enter the display title you would like the column to have in the Caption field.
- Select Choice.

- Click Create.
Note: It is important that you add this column to the report as a Choice column, as this gives you the ability to filter by the column contents in the Reporter UI – as you will see in later sections.
Deploy Custom Report
- Return to your Project Office home page (it should be open in another tab) and click in the Project Summaries header to expose the Reporter ribbon and click Reporter | Configure Reporter Settings.

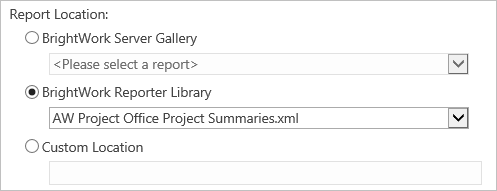
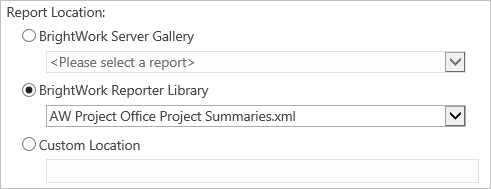
- Select BrightWork Reporter Library and select the report you were just working on.

- Scroll down and expand the Column Settings section, select the column you just added and select 5 from the Position from Left menu.

- Click OK.
- The Region column will now show in the Project Summaries web part.

Project Statement and Reporting
You can display information from the Project Statement list on the same row in a report with items from other lists in the same site.
This means you can create cross-project reports that can filter, group and sort list data based on criteria in the Project Statement.
- Return to the BrightWork Reporter library and click Report Editor on the menu of the Open Work report you created in a previous section.

- Click Add a new column.
- Enter the name of the column and select Choice.

- Make sure the Add this column to the List Query Templates checkbox is selected and click Create.

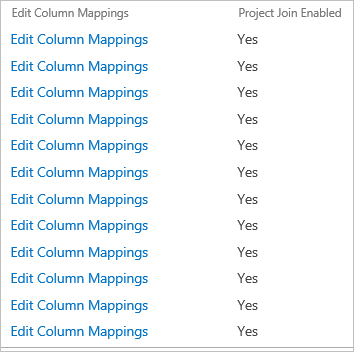
- Click Edit Column Mappings for the first item in the List Query Templates section.

- Select the Include Project Statement Columns checkbox.
Note: You may have to wait a second or two for the page to update. You will know the page has loaded when you see the scroll bars appear on the right. - Scroll down to Region and select From Project Statement.
- Copy and paste the internal name of the column in the field beside this.

- Click Update.
- Repeat for all the other List Query Templates.

Create a New Page and Add Reporter Web Part
In this section you will create a new web part page for the report you just created and add the BrightWork Reporter and Tabs web parts to the page. You will use a BrightWork Web Part page as these include the Quick Launch by default (unlike the standard SharePoint web part page).
- Return to your training Project Office home page and click Settings | Site contents.
- Click BrightWork Pages.
- Click Files | New Document.

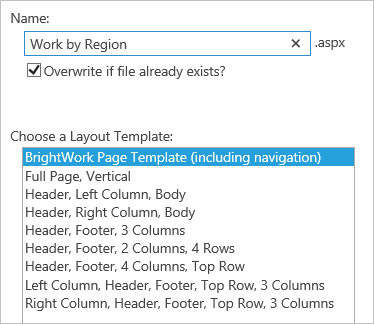
- Give the page a name (for example, Work by Region), choose the BrightWork Page Template, and click Create.

- Click Add a Web Part in the header section.

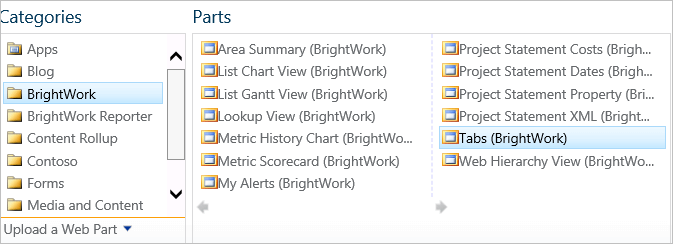
- Select BrightWork | Tabs (BrightWork) and click Add.

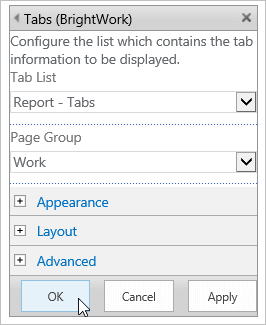
- Click open the toolpane on the Tabs web part.

- Select Work from the Page Group menu and click OK.

- Click Add a Web Part in the Top Row section.
- Select BrightWork Reporter | Reporter (BrightWork) and click Add.
Deploy Custom List Item Report
Next, you will configure the BrightWork Reporter web part you just added, so that it displays your report with the columns you added using the Report Editor.
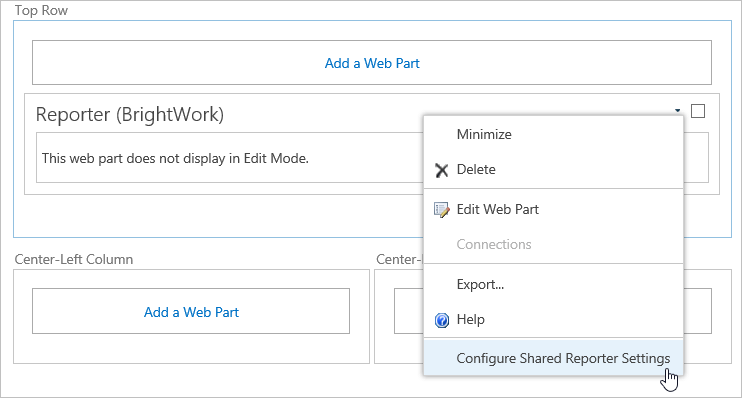
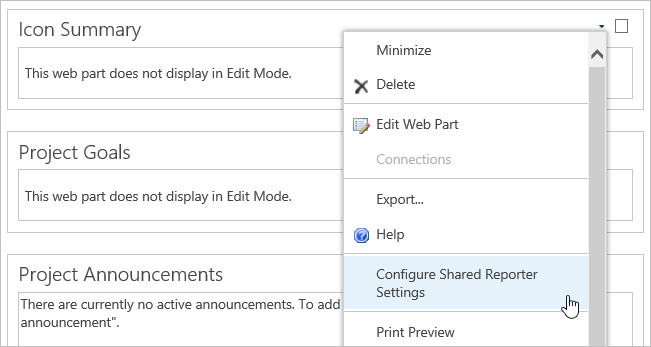
- Click Configure Shared Reporter Settings on the Reporter (BrightWork) web part menu.

- Select BrightWork Reporter Library and select the custom Work report you just created and edited in the Report Editor.

- Select Include all sub-sites.
- Expand the Web Part Settings section and give the report an appropriate title.

- Scroll down to the Column Settings section, select the List Name column and select 5 from the Position from Left menu.

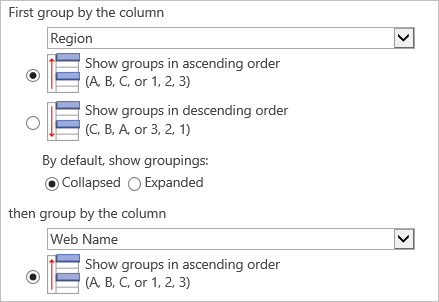
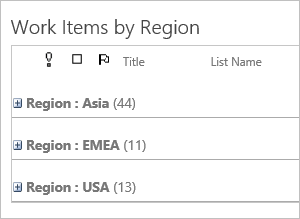
- Scroll down to the Group By section and select Region from the first menu and Web Name from the second.

- Click OK.

Now, when you look across work items, you can see to which region they belong.
Add Report Tab
BrightWork Tabs allow you to extend page links on a site horizontally, as opposed to vertically on the Quick Launch.
Click Work on the Quick Launch and note how there is no tab for your new Work By Region page.

The Tabs web part is driven by the tabs list and you will now add an item to this list for the web part page you just created.
- Click Settings | Site Contents.
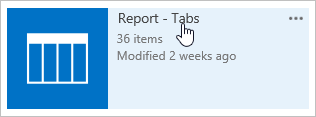
- Click Report – Tabs.

Note: The Tabs web part is driven by this list. Every entry in the report is a tab and every page group is a collection of tabs. - Click edit this list.
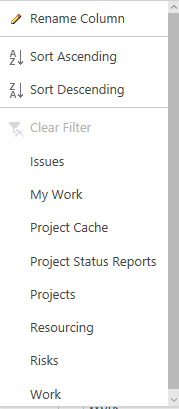
- Select Work on the Page Group filter.

- Select the last five cells in the last item and drag them so as to create a new row.

- Update the Tab Order number to 8.
- Update the Title to Work by Region.
- Update the page name in the Page URL so that it reads ~site/BrightWork Pages/Work by Region.aspx (or whatever is the correct page name of the page you just created).

- Click Stop editing this list.

- Click Work on the Quick Launch.
- Click the Work by Region tab.

The report will display!
Note: If the page you added does not load, check that you entered the page name correctly in the Tabs list datasheet.
Add and Configure a Chart
The Work by Region report you just added above shows the number of work items in each region; however, you can also show this information in a chart.
- Navigate to the Work by Region page you created in a previous exercise.
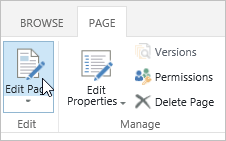
- Click Page | Edit Page.

- Click Add a Web Part in the Center-Left Column and add the BrightWork Reporter web part.

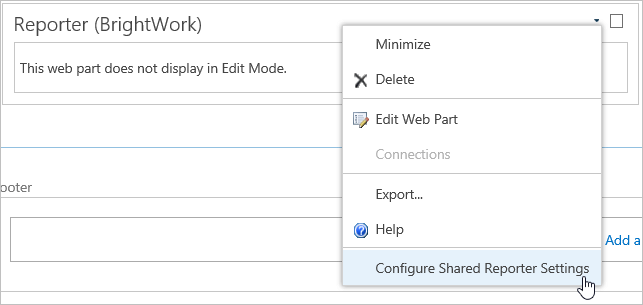
- Click Configure Shared Reporter Settings on the web part menu.

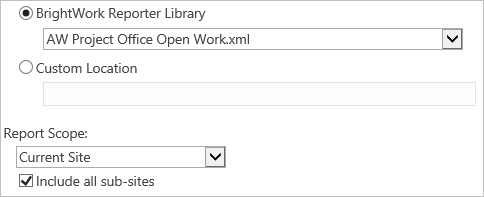
- Select the Work report you used to create the list report that is already on the page and select Include all sub-sites.

- Give the chart an appropriate title.

- Select Chart Report from the Report Type menu.

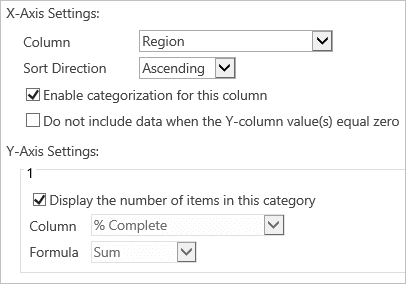
- Select Region as the X-Axis column and select Enable categorization for this column.
- Select Display the number of items in this category in the Y-Axis Settings section.

- Scroll down to the Chart Data Display Settings section and select Show Data Labels.

- Click OK and the chart will display.
Note: It is very important to realize here that the above chart is driven by the same Reporter Definition as the report you setup in Deploy Custom List Item Report. A single reporter definition can produce many different reports.
Suggested Exercises
- Create a Recently Closed Work report page in the Work section of your Project Office site and set the default to display work completed in the past 30 days.
- Modify this report to include the priority of the project the work belongs to from the Project Statement.
5. Add Metrics to Report
In this section, you will learn how to add Metrics to a report.
Introduction
Note: Metrics are measurements that allow you to quantify the state of a system. They enable you and other project stakeholders to quickly and scientifically measure progress and make important decisions as to the direction and scope of the project. Metrics are covered extensively in the Project Metrics List Training Guide.
You can add certain values generated by a Project Metric to a Project Statement report and display them on the same line as the project that the metric belongs to in a report. This is known as a Project Metric Join.
The values you can add include:
- Metric Value
- Target Value
- Indicator Icon
- Indicator Status
- Formatted Metric Value
- Formatted Target Value
- Formatted Warning Value
- Formatted Danger Value
Add Metrics to Reporter Definition
In this section, we will get you to add the Planned Finish Date Warning metric you created in the Project Metrics Guide to the first report you created in this guide.
Note: To complete the exercises in this section, you will need to have completed the Project Metrics List Training Guide.
To create a Project Metric join:
- Return to the BrightWork Reporter library and select Report Editor on the menu of the Project Summaries report you created earlier (see Create Copy of a Report section).

- Scroll down to the Project Metric Joins section and click Add a new project metric join.

- Click Change Selected Site on the Selected Site menu.

- Click the page navigator at least twice until sites from the Training Area are displayed.

- Click on the site you created with the Project Standard template. This is the site where you added the Planned Finish Date Warning metric.

- Click Change Selected List on the Selected List menu.

- Click Project Metrics.
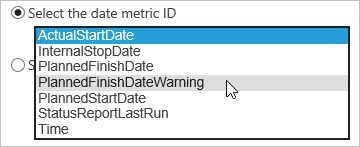
- Click Select the date metric ID and select the PlannedFinishDateWarning metric.

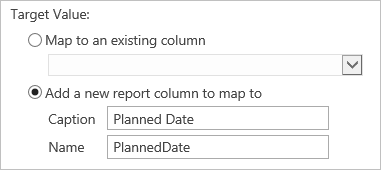
- Select Add a new report column to map to for the Target Value and enter an appropriate Caption. The Name field will automatically populate based on this.

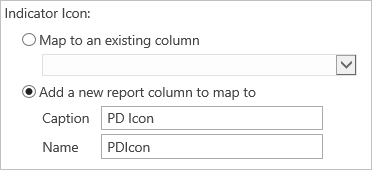
- Repeat this process for the Indicator Icon column.

- Click Create at the bottom of the page. Now these metric items will be available for selection as columns in the report.
Configure Report to Include Metric
In this section, you will update a displayed report on a project page so that it includes the Metric you just added.
- Navigate to the site you created using the Project Standard template.
- Click Page | Edit Page.
- Click Configure Shared Reporter Settings on the Icon Summary web part menu.

- Load the report you added the Metric to.

- Scroll down the Columns section and unselect all the columns.
- Select the following columns and assign them the following positions:
- Issues 1
- Time 2
- Health 3
- PD Icon 4
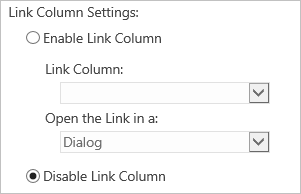
- Select Disable Link Column.

- Click OK. The report will load.

