Configuring BrightWork Reporter
The purpose of this guide is to introduce you to Configuring the BrightWork Reporter web part.
1. Introduction
BrightWork Reporter is a highly configurable web part that lets you query multiple sites, sub-sites and lists, and displays the results in a single report. BrightWork Reporter includes multiple configuration options that let you create personal reports, filter and sort the report data, and create cross-list and cross-site report filters.
Prerequisites
At a minimum, you will have created your own Training Project Office following the Create a BrightWork Training Project Office in the Introductory Guide, and have completed the Project Manager, and Senior Executive training guides.
Suggested Exercises
At the end of many chapters you will see some Suggested Exercises that you should be able to complete on your own, based on what you have just done.
These suggested exercises will not contain any steps – you will need to apply what you have learned to do the exercise. We strongly recommend you complete these suggested exercises, as they will help to reinforce what you have just learned.
2. Reporter Web Part Overview
In this section, you will learn about the various options in the Reporter web part.
Introduction
BrightWork Reporter is a SharePoint web part that can display SharePoint data from multiple lists in multiple sites in a single report. Every BrightWork template contains many different reports. Some are displayed on the template home page and some are grouped according to function e.g. Project, My Work etc.
Every BrightWork report is driven by one of three data sources: a Reporter Definition, the Project Cache, or the Work Cache. The basic structure of the report (i.e. lists and columns available to be reported on, any report filters and a standard setup for the report) is defined in the relevant data sources.
For the purposes of configuring reports, you will probably not need to worry about report data sources for now. For more information on data sources, see the Working with Report Data Sources Guide.
Reports can be rendered in four different ways: Chart, Gantt, List, and Resource. Report configuration is generally done via the Reporter Tools ribbon or the Reporter Settings page.
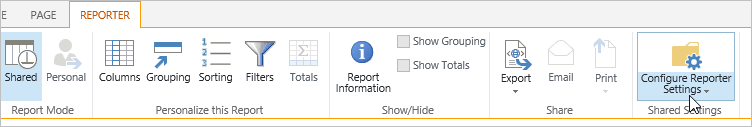
About the Ribbon
The Reporter Tools ribbon offers quick configuration access for certain report types. To change things like the columns displayed in a report, the grouping and sorting, display of totals and create report filters, use the Reporter Tools ribbon. The Reporter Tools ribbon also allows you to create a personal report.
Note: You created personal reports in the Project Manager training guide.
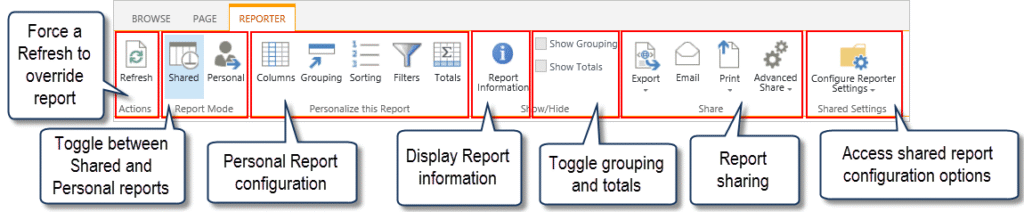
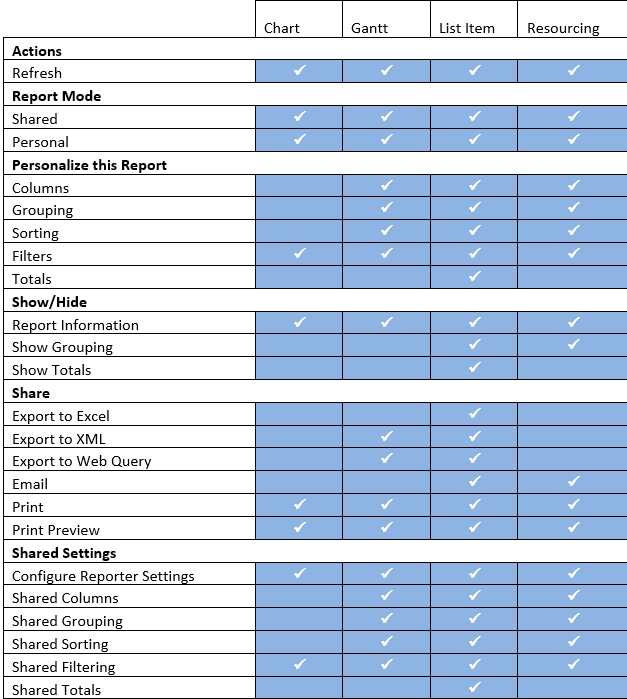
The options available in the ribbon vary according to the report type, site features that are activated and the permissions available to the logged in user.
Use the image above and the table below as a reference – it will all make more sense once you have completed the guide! It is likely that most of the configuration changes you will make to reports will actually be to List Item Reports via the ribbon.
About the Reporter Settings Page
The Reporter Settings page offers some of the configuration options available on the ribbon and some extra ones not available on the ribbon. Some examples of configuration options unique to the Reporter Settings page are: Chart customization, Link Column options, Data Source and Report Scope settings, Web Part title
Note: Changes made to the Reporter Settings page show for all users. Using the ribbon to customize your report keeps your changes personal and allows you to filter the report to your needs.
The Reporter Settings page will vary depending on the report type; however, all four report types share some common options.
The common sections are:
-
Report SettingsThis section is where you select things like the report, the report scope and the report type. You will not need to worry about this section until the Working with Report Data Sources guide.
-
Web Part SettingsThis section is where you set the report title and the report chrome settings.
-
Rendering and PerformanceThis section is where you fine tune report performance and set certain display options. You generally will not have to worry about this section unless your report is reporting from a very large data set. This section will also be covered in the Working with BrightWork Report Data Sources guide.
3. Change Report Title
In this section, you will change the title of a report.
Change Report Title
The procedure for changing the Report title is the same for all report types.
-
Navigate to the home page of your training project office.
-
Click in the Project Office Summary header and click Reporter | Configure Reporter Settings.

-
Expand the Web Part Settings section and enter the name of your project office before the Project Office Summary text.
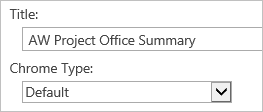
-
Click OK.
Suggested Exercise
Change the title of the ‘Project-Costs’ report to ‘Project Costs’.
4. Configure a Chart Report
In this section, you will change the style and features of a chart.
Configure a Chart Report
Chart Reports display data from lists in visual reports such as Pie or Bar charts.
Note: This section assumes that you have a basic understanding of how charts and graphs work. See here for a quick overview.
-
Navigate to the home page of your training project office.
-
Click Status Charts on the Top Link bar.
-
Click in the Status chart header and click Reporter | Configure Reporter Settings.

-
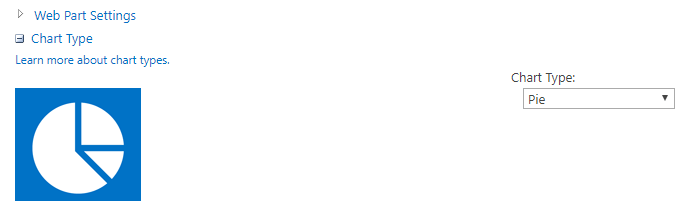
Select Pie from the Chart Type menu.
-
Scroll down and expand the Chart Data Display Settings section.
-
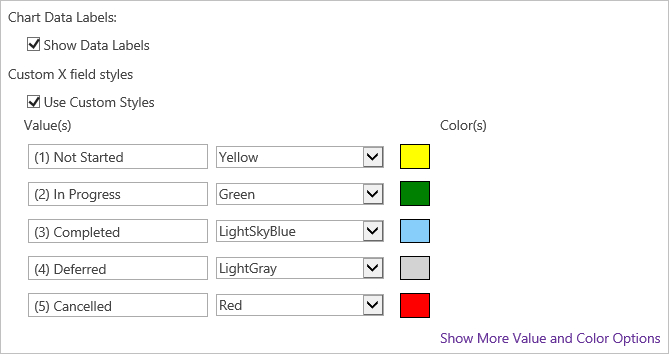
Select Use custom styles.
-
Enter (1) Not Started in the Value(s) field and select Yellow from the Color(s) menu.
-
Click Show More Value and Color Options and set the chart up as follows.
-
Click OK.
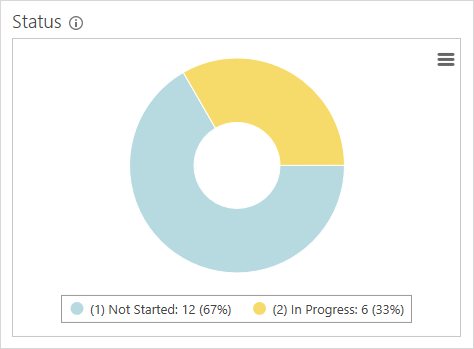
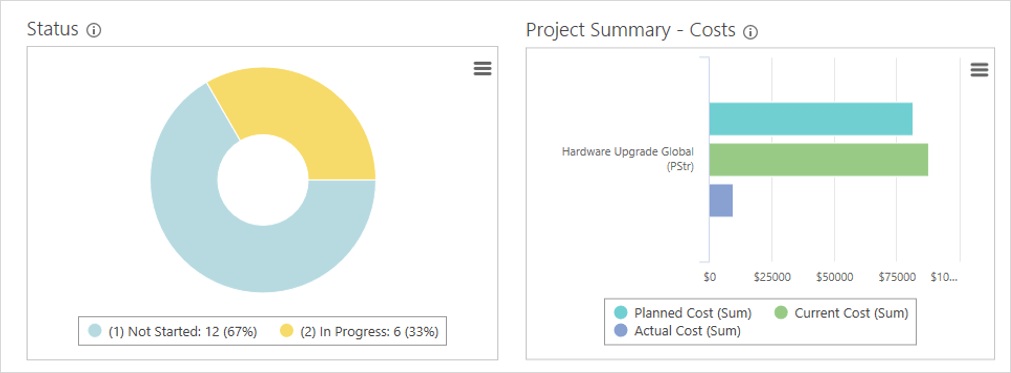
The chart will display with your updated settings.
Note: See the Configure Chart Reports topic in the BrightWork help for more information on configuring charts. The Working with Report Data Sources guide also contains information on adding and setting up charts.
If you only need to represent data from a single list, you should use the List Chart View web part. The main advantage of this web part is that it automatically picks up the columns you add to the list. With BrightWork Reporter charts, these columns have to be added to the report, as you will see in the Working with Report Data Sources guide.
See the List Chart View Help topic for more information.
Suggested Exercise
Change the status chart to a Spline with the Chart Theme set to Bright 1.
5. Configure a Gantt Report
In this section, you will add a filter to the Project Gantt report and alter its appearance.
Introduction
A Gantt chart provides a graphical illustration of items in a schedule that helps to plan, coordinate, and track specific tasks in a project. To show items correctly, the Gantt report needs a Start Date and an End Date.
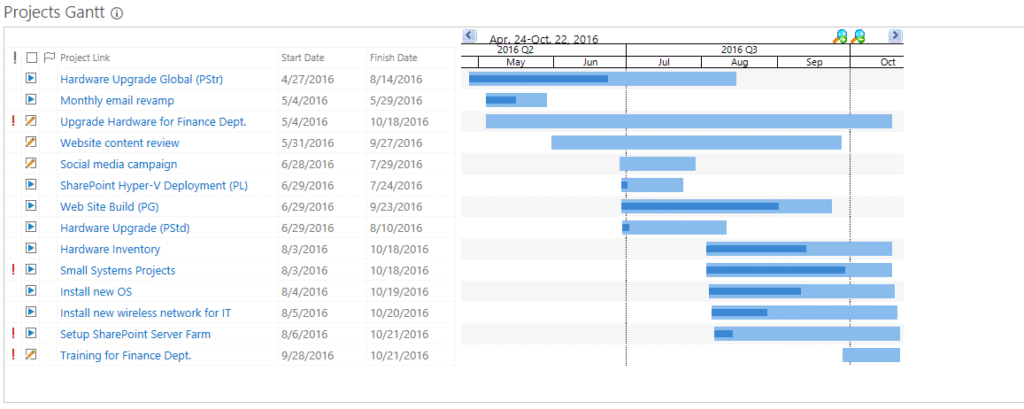
Add a Filter to Gantt
In this section you will use the Reporter Tools ribbon to add a filter that excludes completed items from showing in the report.
-
Navigate to the home page of your training project office.
-
Click the link to the Hardware Upgrade site in the Project Hierarchy web part.
Note: This is the Project Lite site you created in the Create a Training Project Office training guide – it may be named something else. -
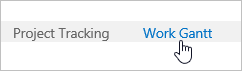
Click Work Gantt on the top link bar.
-
Click in the header of the Project Gantt report to activate the Reporter Tools ribbon for the report.
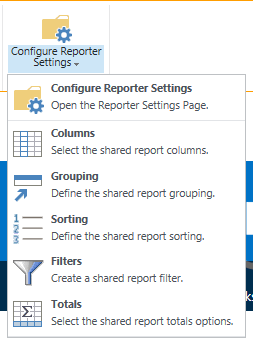
-
Click Filters on the Configure Reporter Settings menu.
-
Select Status from the Column Name menu.
-
Select is not equal to from the Comparison Type menu.
-
Enter Completed into the Comparison Value field.

-
Click OK.
Change the Gantt Appearance
In this section you will use the Reporter Settings page to change the appearance of the Gantt.
-
Click in the Project Gantt header and click Reporter | Configure Reporter Settings.

-
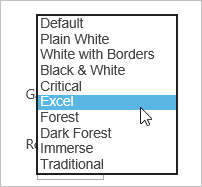
Expand the Gantt Appearance section and select Excel from the Gantt Theme menu.
-
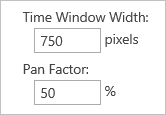
Expand the Time Window Settings section and increase the Time Window Width to 750.
-
Click OK.
Suggested Exercises
Change the Gantt name to ‘Project – Gantt’, the theme to ‘Forest’, and the Time Window Width to a number of your own choosing.
6. Configure a List Item Report
In this section, you will change and group the columns in a List Item Report.
Introduction
A list item report is similar to a SharePoint view, except, like all BrightWork reports, it is able to report across multiple lists and sites.
With the List Item Report, practically everything pertaining to report configuration can be set in the Reporter Tools ribbon.
Configure List Item Report using the Ribbon
-
Navigate to the home page of your training project office.
-
Click the link the Hardware Upgrade site on the Quick Launch.
Note: This is the Project Lite site you created in the Create a Training Project Office training guide – it may be called something else. -
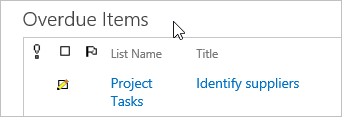
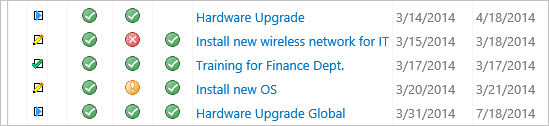
Click in the header of the Overdue Items report to expose the Reporter Tools ribbon.
-
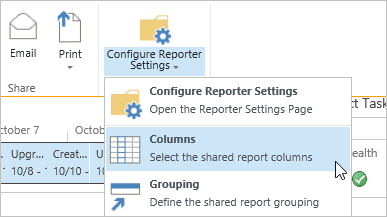
Click Columns on the Configure Reporter Settings menu.
-
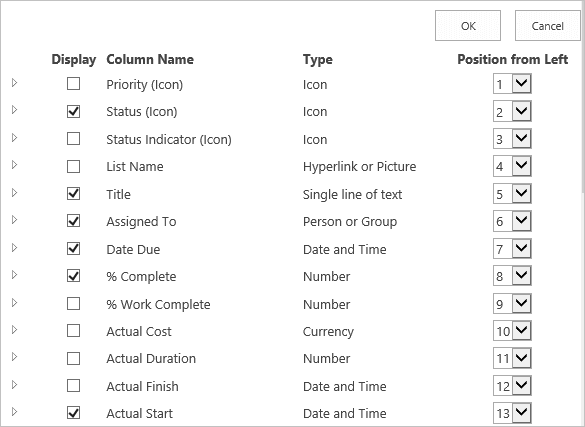
Unselect the Priority (Icon), Status Indicator (Icon), and List Name columns.
-
Select the % Complete and Actual Start columns.
-
Click OK.
-
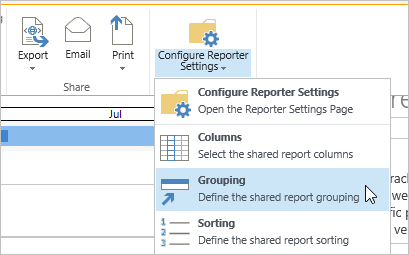
Click Grouping on the Configure Reporter Settings menu.
-
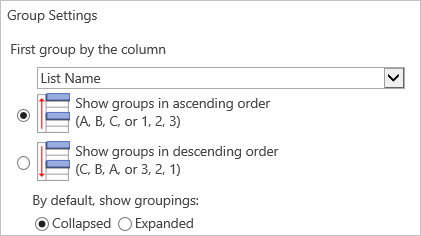
Select List Name.
-
Select Collapsed.
-
Scroll down and click OK.
Adjust Column Width
Navigate to the home page of your training project office. If you look at the Project Summaries report on the home page, you may notice that two projects appear to have the same name. These are in fact different projects – the Project Link column that displays the Project title is not wide enough to display the full title – you will remedy this in the following exercise.
-
Click in the header of the Project Summaries Web Part to expose the Reporter ribbon. Click Configure Shared Reporter Settings.
-
Scroll down and expand the Column Settings section.
-
Enter 200 in the Project Link Column Width field.
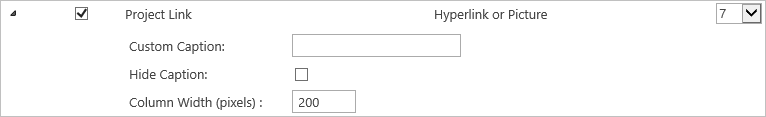
-
Click OK.The full Project title should now be visible.
Suggested Exercise
In your training project office, add the ‘Actual Start’ and ‘Created’ columns to the Issues\Open Issues report.
7. Configure a Resource Report
In this section, you will learn how to change the settings on a Resource Report and how its appearance can be adjusted.
Introduction
Resource Usage reports display how much work has been assigned and allocated in a calendar-like view. The report shows the hours allocated to a particular item and to the grouping(s) selected on the Reporter settings page (e.g. Assigned To, Role, List Name, Project etc.).
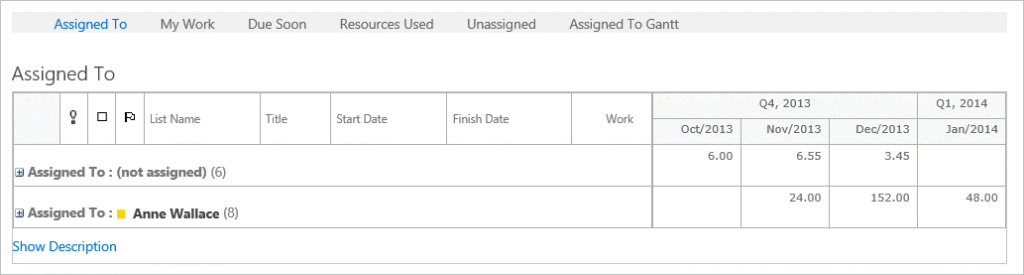
Trigger Resource Report Over-Allocation Alert
One of the main purposes of the Resource report is to show you when a resource is over-allocated (i.e. when they have been assigned more work than there is time available); however, it is quite likely that the resource reports you are using in your training are not showing anyone over-allocated.
In this section you will force a Resource Report to show an over-allocation alert.
Note: This section assumes that you have assigned yourself some work that contains a start date, finish date and work duration value.
-
Navigate to the home page of your training project office.
-
Click Resourcing on the Quick Launch.
-
Click in the header of the Assigned To web part to expose the Reporter ribbon. Click Configure Reporter Settings.
-
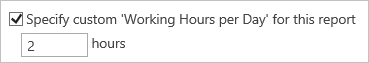
Select Specify custom ‘Working Hours per Day’ for this report.
-
Enter 2 in the hours field.
-
Click OK.This report should light up with some yellow cells.
Configure Resource Report Appearance
The out-of-the-box Resource report can show a lot of data. In this exercise you will narrow the focus of the report.
-
Click in the header of the Open Work web part to expose the Reporter ribbon. Click Configure Reporter Settings.
-
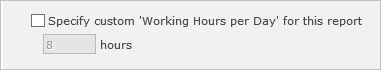
Unselect Specify custom ‘Working Hours per day’ for this report.
-
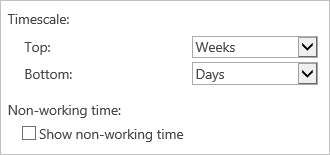
Scroll down and expand the Timescales section.
-
Select Days from the Bottom menu.
-
Select Weeks from the Top menu.
-
Expand the Time Window Settings section.
-
Select From Today.
-
Enter 0 in the Looking Back field.
-
Enter 3 in the Looking Forward field and leave Weeks selected.
-
Click OK.
Suggested Exercises
-
Change the Resource Report Date Settings by changing the Start Date Column to ‘Planned Start’ and the Finish Date Column to ‘Planned Finish’.
-
Change the Time Window setting Looking Back to 1.
8. Report Email Scheduler
As well as being able to email reports on demand, you can also setup reports to email on a schedule. You can even set reports with user filters (e.g., My Work) to email each user about their assigned items.
A common use of this is setting up the My Work email report to email all users their personal My Work report every Monday morning.
Scheduled Emails are security smart. They only include items from the sites and lists accessible by the recipients. Their email will only contain the information they would see if they logged onto the report itself.
Activate Scheduled Email
The Scheduled Report Email site feature must be activated on a site by site basis. If it is not activated, the Created Scheduled Email button will not be available in the Reporter ribbon. Users with elevated privileges are able to activate this feature.
Note: To ensure that users do not receive multiple or duplicate emails, we recommend only sending them from the Project Area or Project Office.
-
Click Sample Area on the top link bar.

-
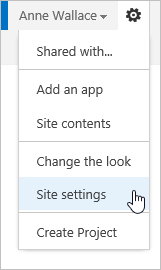
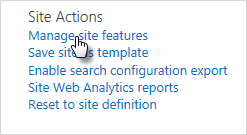
Click Settings | Site Settings.
-
Click Manage site features.
-
Click Activate on the BrightWork Scheduled Report Email feature.
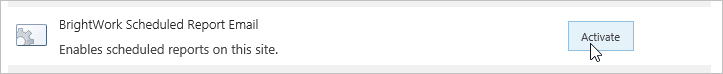
Note: This feature may already be active.
Create Scheduled Report Email
To schedule an email:
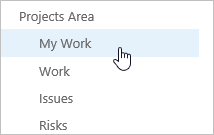
-
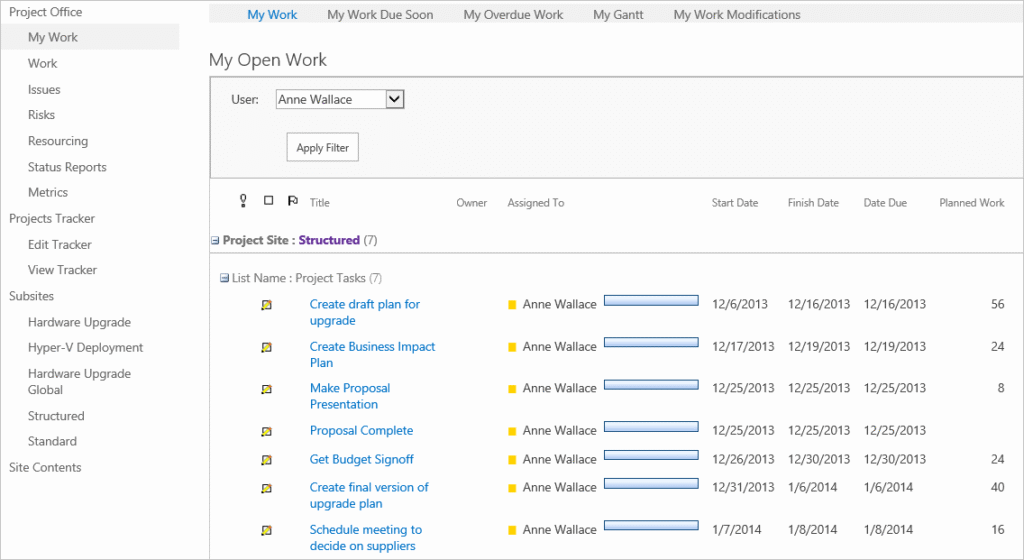
Click My Work on the Quick Launch.
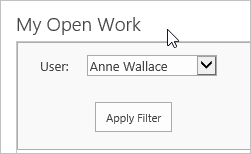
-
Click in the My Open Work header to expose the ribbon.
-
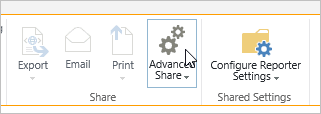
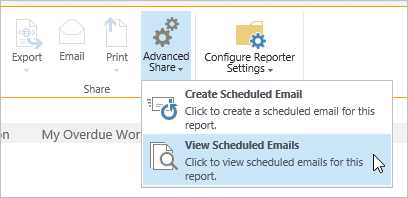
Click Advanced Share.
-
Click View Scheduled Emails.
Note: It is best practice to check the View Scheduled Emails list before creating a new scheduled email. This makes sure you are not duplicating an existing scheduled email.
-
Click Create.
-
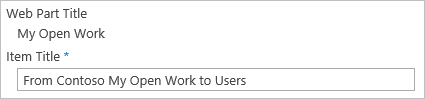
Give the email a descriptive title, e.g. Your Open Work.
-
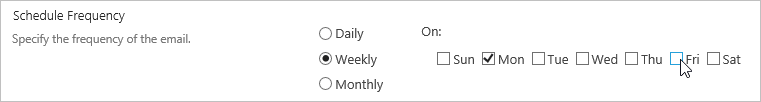
Deselect Tue, Wed, Thu, and Fri, in the Schedule Frequency section.
-
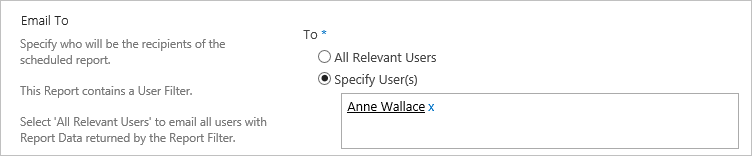
Click Specify User and add your name to the list.
-
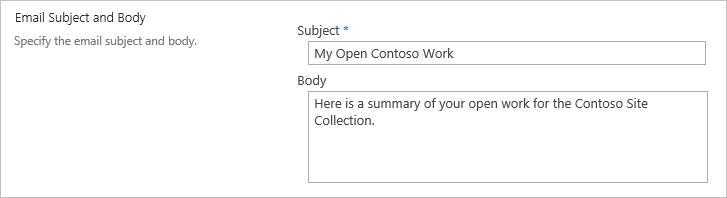
Enter a subject, e.g. Your Open Work.
Note: You can use [Me] to place the recipient’s name in the title, e.g. Open Work Assigned to [Me]. This will generate the title: Open Work Assigned to Anne Wallace. -
Enter content for the email body.
-
Click Save.
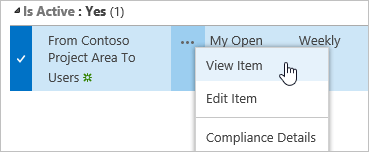
Your scheduled email is now set to run every Monday morning, detailing what work is still open in the Contoso project area. You can also choose to run the scheduled email immediately. -
Click View Scheduled Emails in the Advanced Share button, and then View Item for the scheduled email item.
-
Click Run Email Now.
For more information, please see the Create Scheduled Report Email BrightWork help topic.
9. Reuse a Web Part
In this section, you will learn how to reuse a report that you have custom configured.
Reuse a Web Part
Web parts with a large number of configuration options, such as BrightWork Reporter, have an almost infinite number of final configuration possibilities. Getting the report configuration right can take a while! Once you get it right, repeating this work can be a pain. Fortunately, SharePoint allows you to export the web part and upload it to the site collection Web Part Gallery for easy reuse.
Note: Exporting a reporter web part does not export any associated scheduled emails.
-
Return to the List Item Report in the Project Lite site you configured in the section Configure List Item Report using the Ribbon.
-
Click Page | Edit Page.
-
Click Export on the List web part menu and save the web part to your desktop.
Note: The web part will be saved as a .dwp file. -
Navigate to the home page of the entire site collection and click Settings | Site Settings.
-
Navigate to the home page of the entire site collection and click Settings | Site Settings.

-
Click Web parts.
-
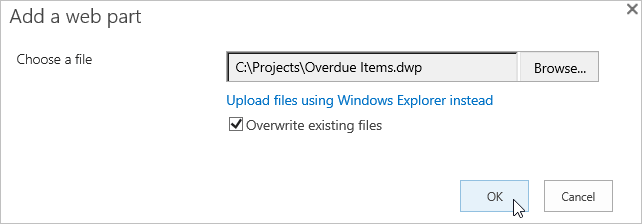
Click Files | Upload Document.
-
Click Browse, navigate to the location where you have the .dwp file stores, select it and click OK.
-
Make any appropriate changes and click Save.
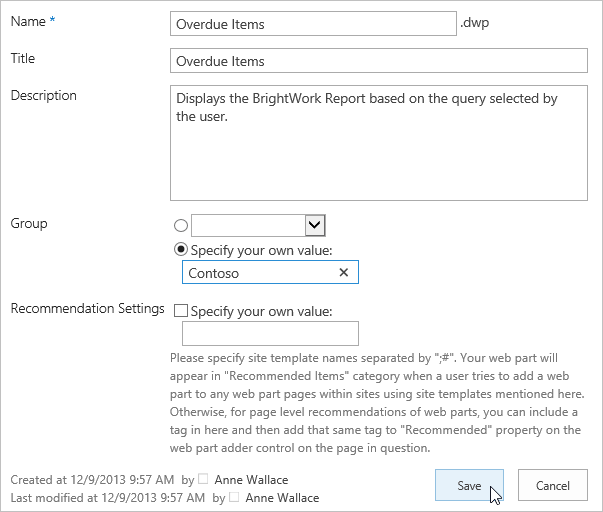
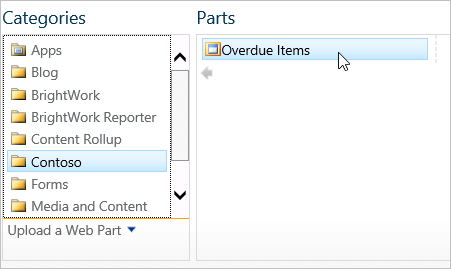
Note: We recommend that you add your web parts to a custom group (e.g. Contoso, as shown above) to make them easier to identify when adding them – especially if you are taking this training in a shared environment.
This web part will now be available to add (with all the configuration and setup done) to any web part page in the site collection.
Note: You can add the .dwp file to the Web Part Gallery in another site collection; however, if the report uses a Reporter Definition in the BrightWork Reporter Gallery, you will also have to ensure that the XML file is uploaded to the BrightWork Reporter Library in the destination site collection.
Suggested Exercise
Make changes to the ‘Top Open Issues’ web part on the Project Home, save it as a .dwp file and add it to the Contoso group in the site collection’s Web Part Gallery.
10. About BrightWork Reporter and Design Sync
In this section, you will see how Reporter works with the Design Sync feature.
Introduction
BrightWork includes a feature called Design Sync that enables you to make design changes to a template in the Templates Area and sync those changes to the sites created from this template.
For the most part, configuration changes you make to web parts such as BrightWork Reporter are excluded from Design Sync.
The exceptions to this are when the page the report is located on is replaced. There are two scenarios where this can happen: on the project home page and/or on BrightWork web part pages.
Note: It is important to understand that both the scenarios described here mean that a page is being completely replaced by another page. This means that all other customizations on the page to be replaced (such as personal reports) will be lost.
Apply Home Page Design
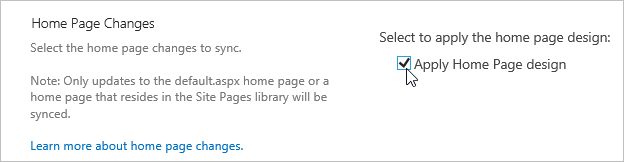
The Apply Home Page Design feature of Design Sync enables you to replace the home page in a project site with the home page in the template. You may want to do this to reapply the original home page from the template (to eliminate any design changes made to the home page in the project site) or you may want to do it to propagate a new home page design (such as new added web parts or changes made to existing web parts).
To apply the Home Page Design:
-
Navigate to the home page of your Project Office.
Note: In the section, Adjust Column Width, you changed the report settings of the Project Summaries report. The Apply Home Page design sync will remove this change. -
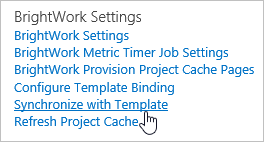
Click Settings | Site Settings and click Synchronize with Template.
-
Select the Apply Home Page design checkbox.
-
Click Sync and then OK.
-
Click Project Home. Note that the Project Summaries report has now reverted to the template original and the customizations have been lost.
Replace BrightWork Web Part Pages
Design Sync does not support updating pages other than the home page; however it does support the copying of new web part pages in the BrightWork library from the template to the project site. This means you can delete a page in the project site and it will be recopied over from the template using Design Sync.
To sync new reporter web parts from template to project:
-
Navigate to the desired project site.
-
Click Tasks Reports on the Quick Launch.
-
Click Page | Delete Page.
-
Click OK. You have deleted the Tasks Reports page – note how it no longer appears on the Quick Launch.
-
Click Settings | Site Settings, then Synchronize with Template.
-
Select the Quick Launch checkbox.
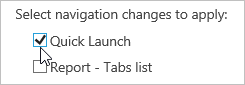
-
Click Sync and then OK. The Tasks Reports page has now been recreated with any new changes in the template synced.
Looking for templates on Microsoft 365?
BrightWork 365 lets you plan, manage, and collaborate in Microsoft 365.