Control portfolios with dashboards
in Power Apps and Power BI
Control Your Project Portfolios With Interactive Dashboards
in Power Apps and Power BI
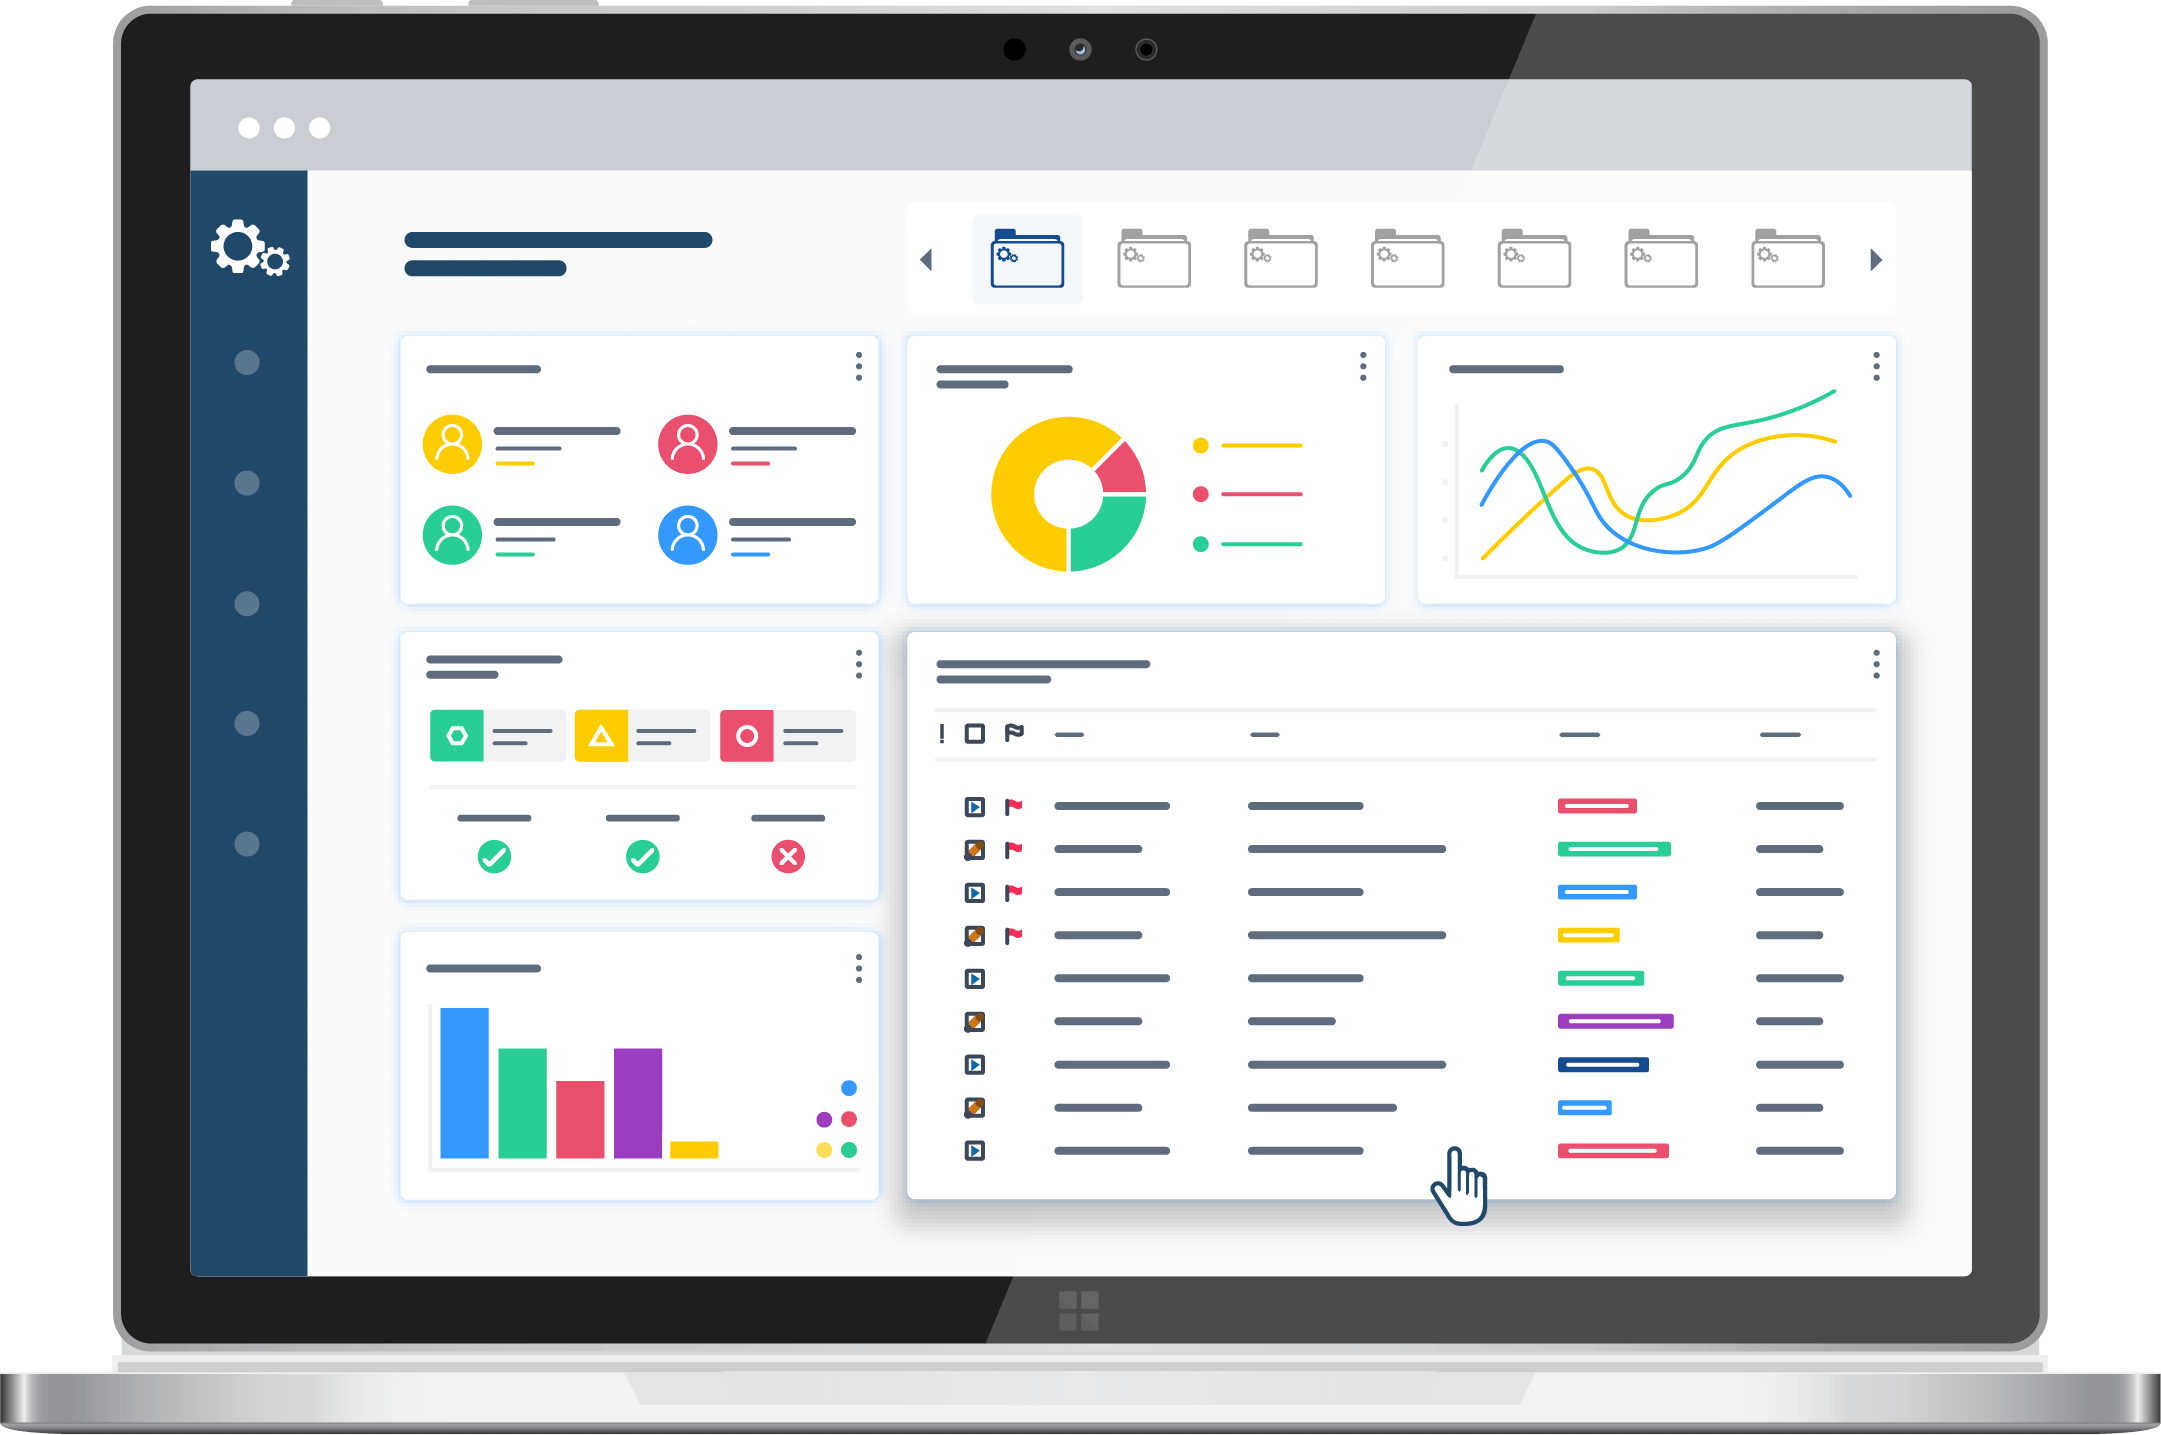
Get a 360° overview of your project portfolios with a user-friendly interface and reports.
Track the progress of your project portfolios at a glance with indicators for status, health, issues, and late tasks.
Capture real-time data and customize it to create and share project performance reports in a few steps.
Save time in decision-making with quick access to accurate data and information.
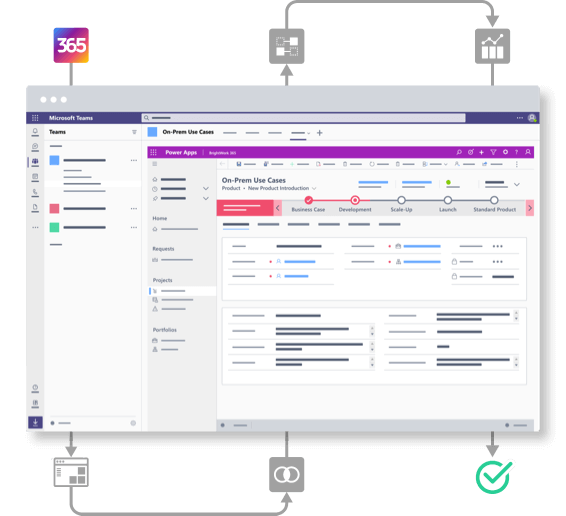

See how you can leverage project management dashboards in Microsoft 365
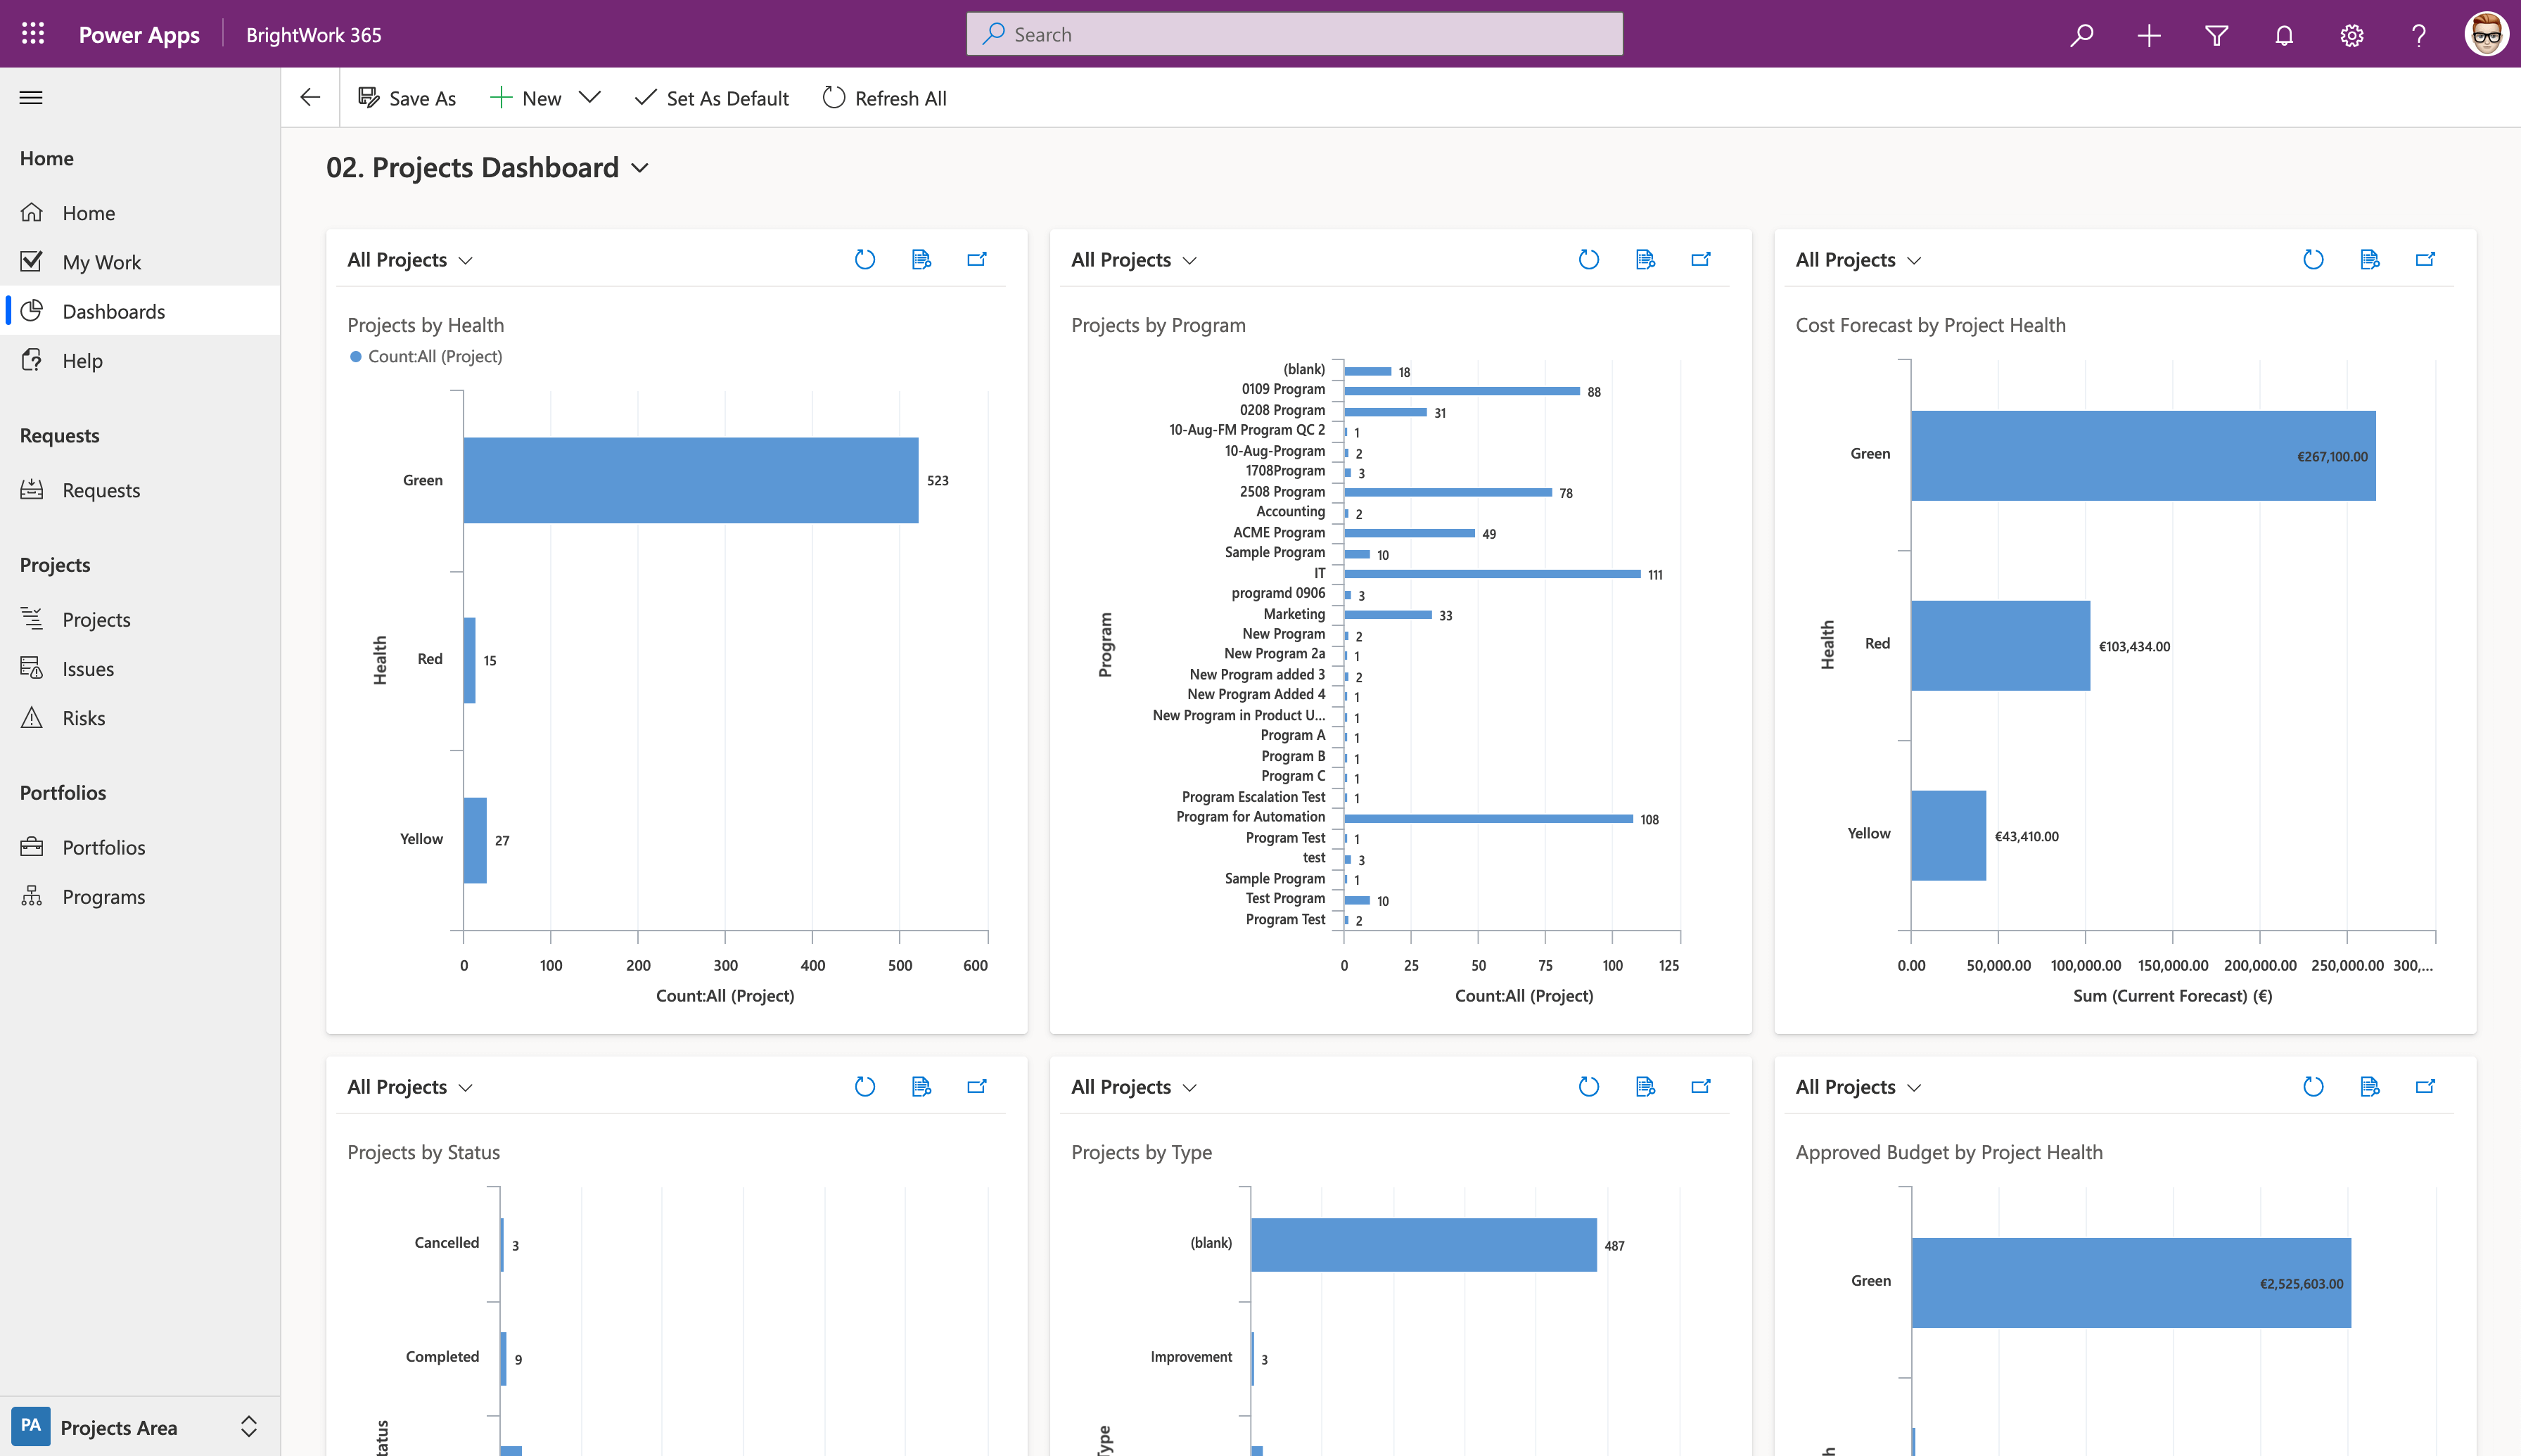
Power Apps Dashboards
With multiple Microsoft Power Apps charts and project management templates, you can view the different aspects of your projects.
Use a range of charts such as ‘My Projects’ and ‘My Teams Projects’ to help you further drill down into the details of each project.
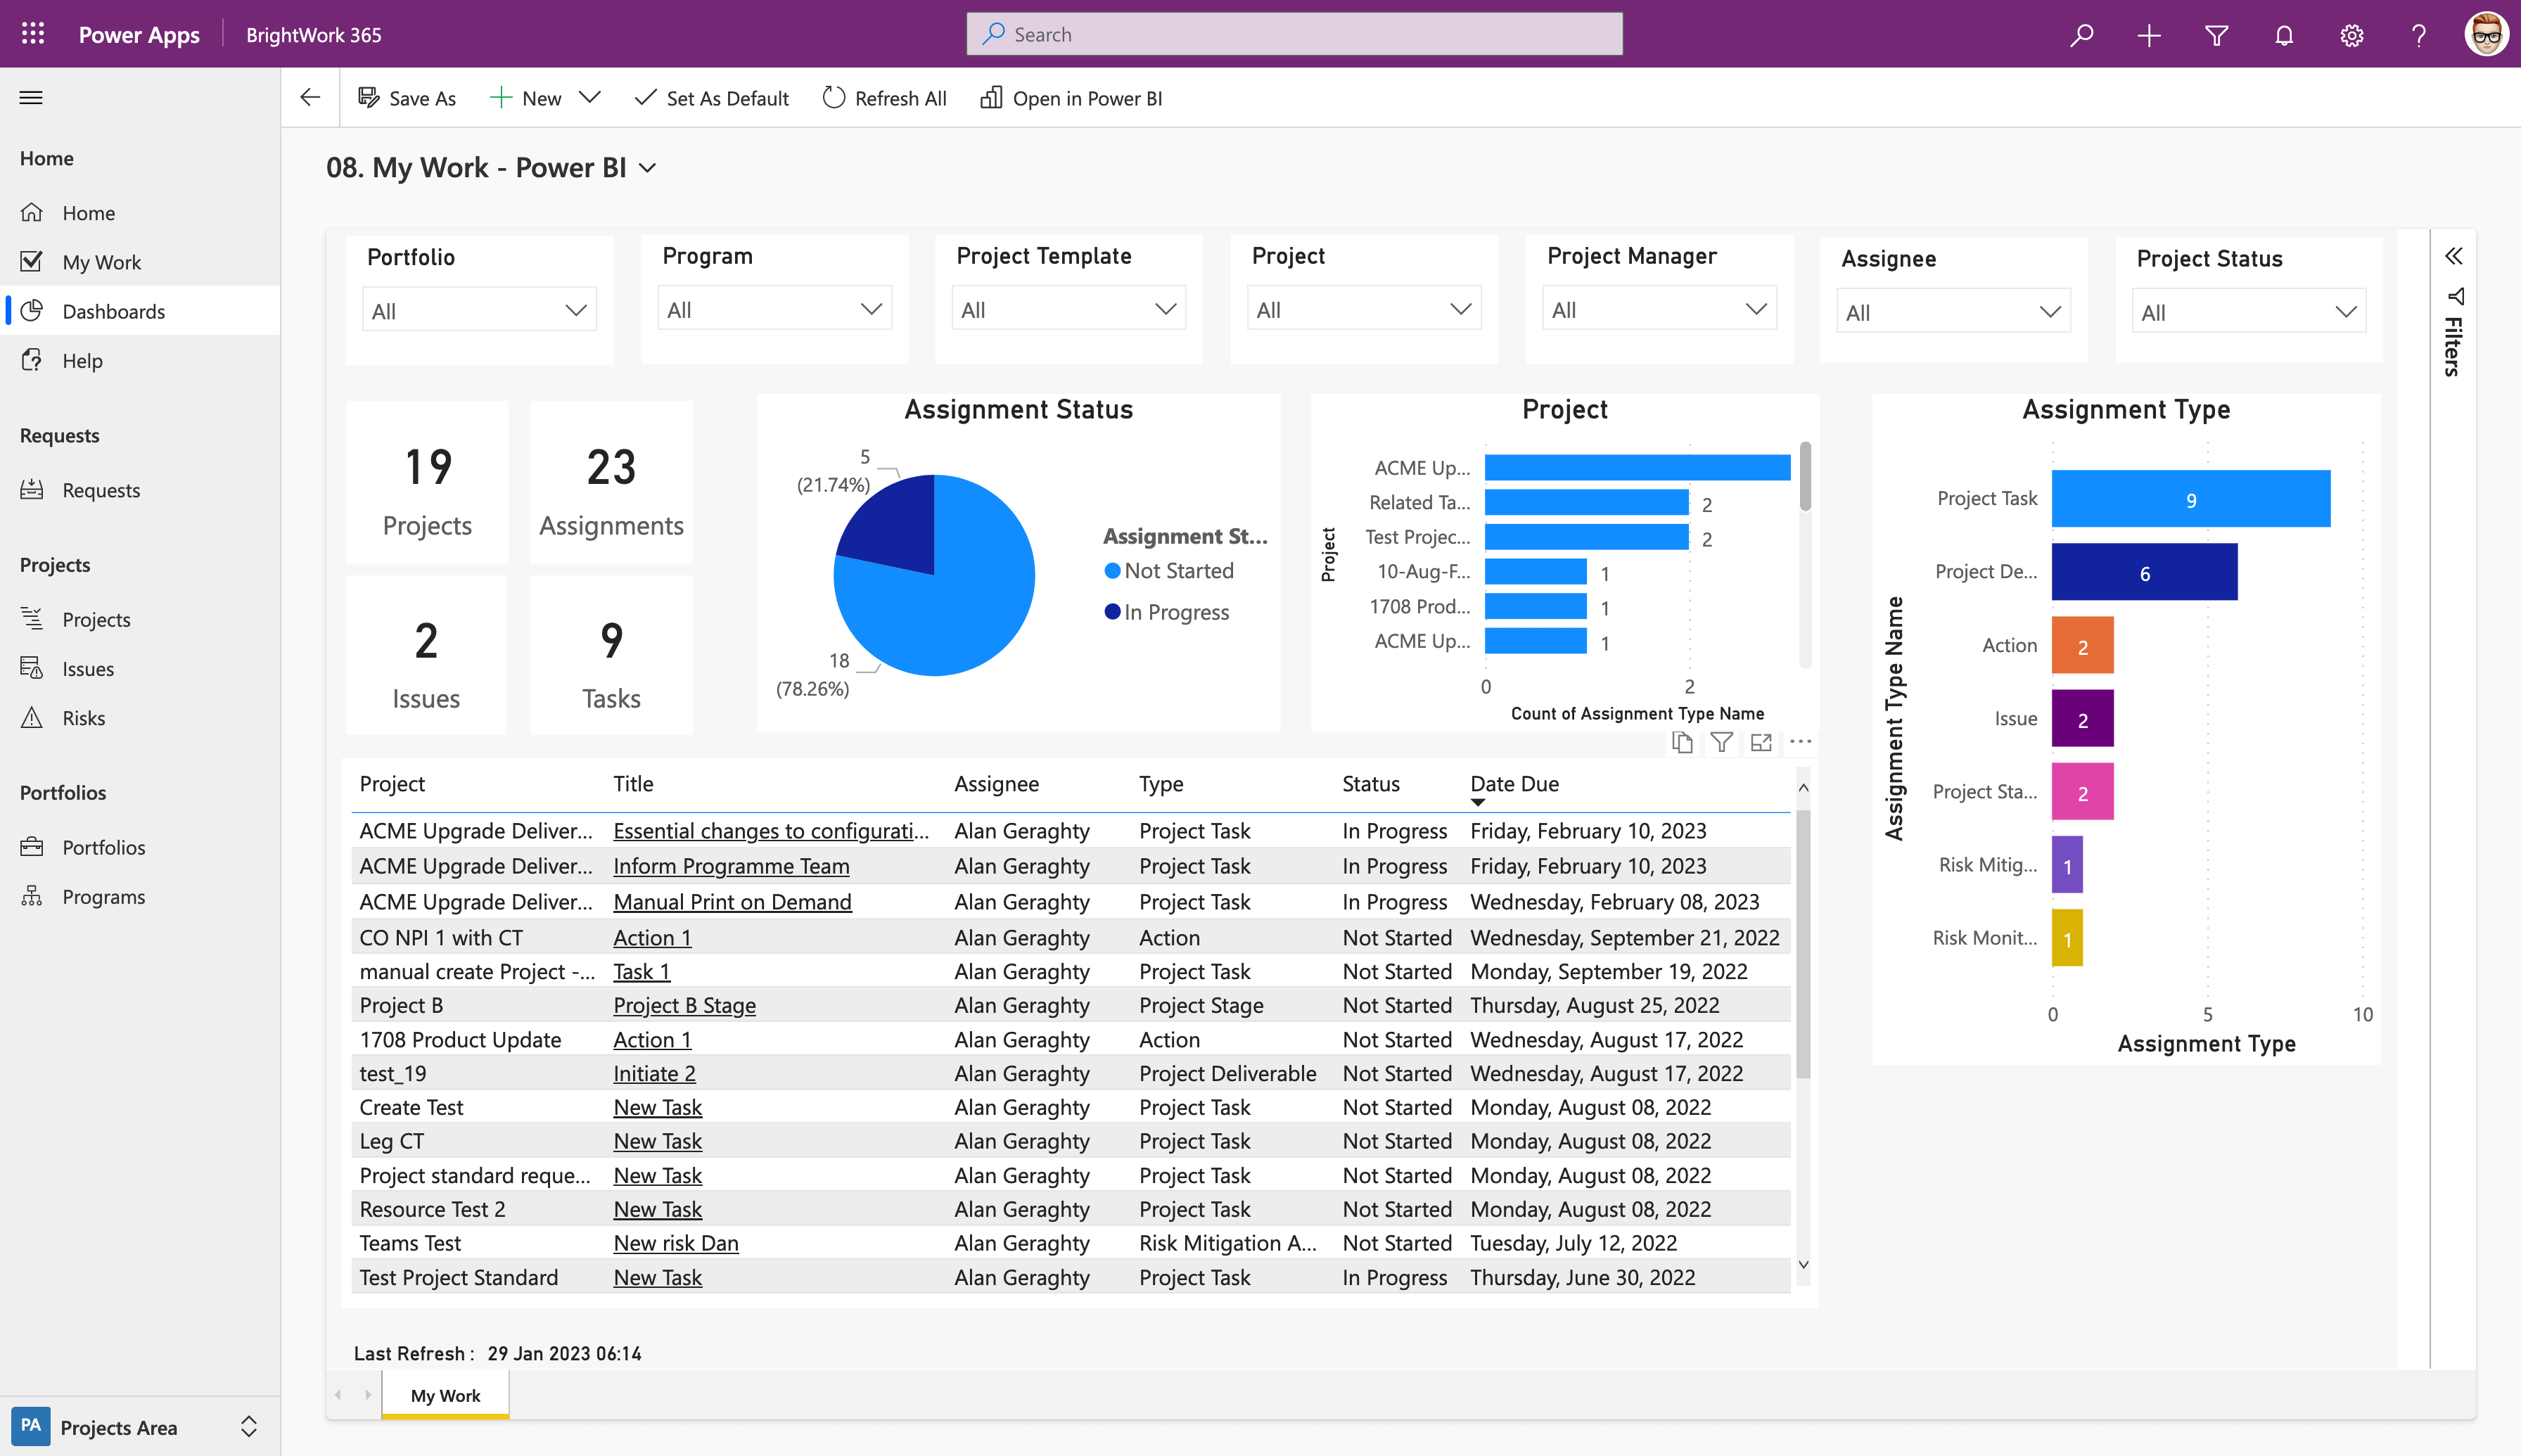
Power BI Reports
BrightWork 365 and the Microsoft Power BI business analytics tool provide exceptional data visualization functionality.
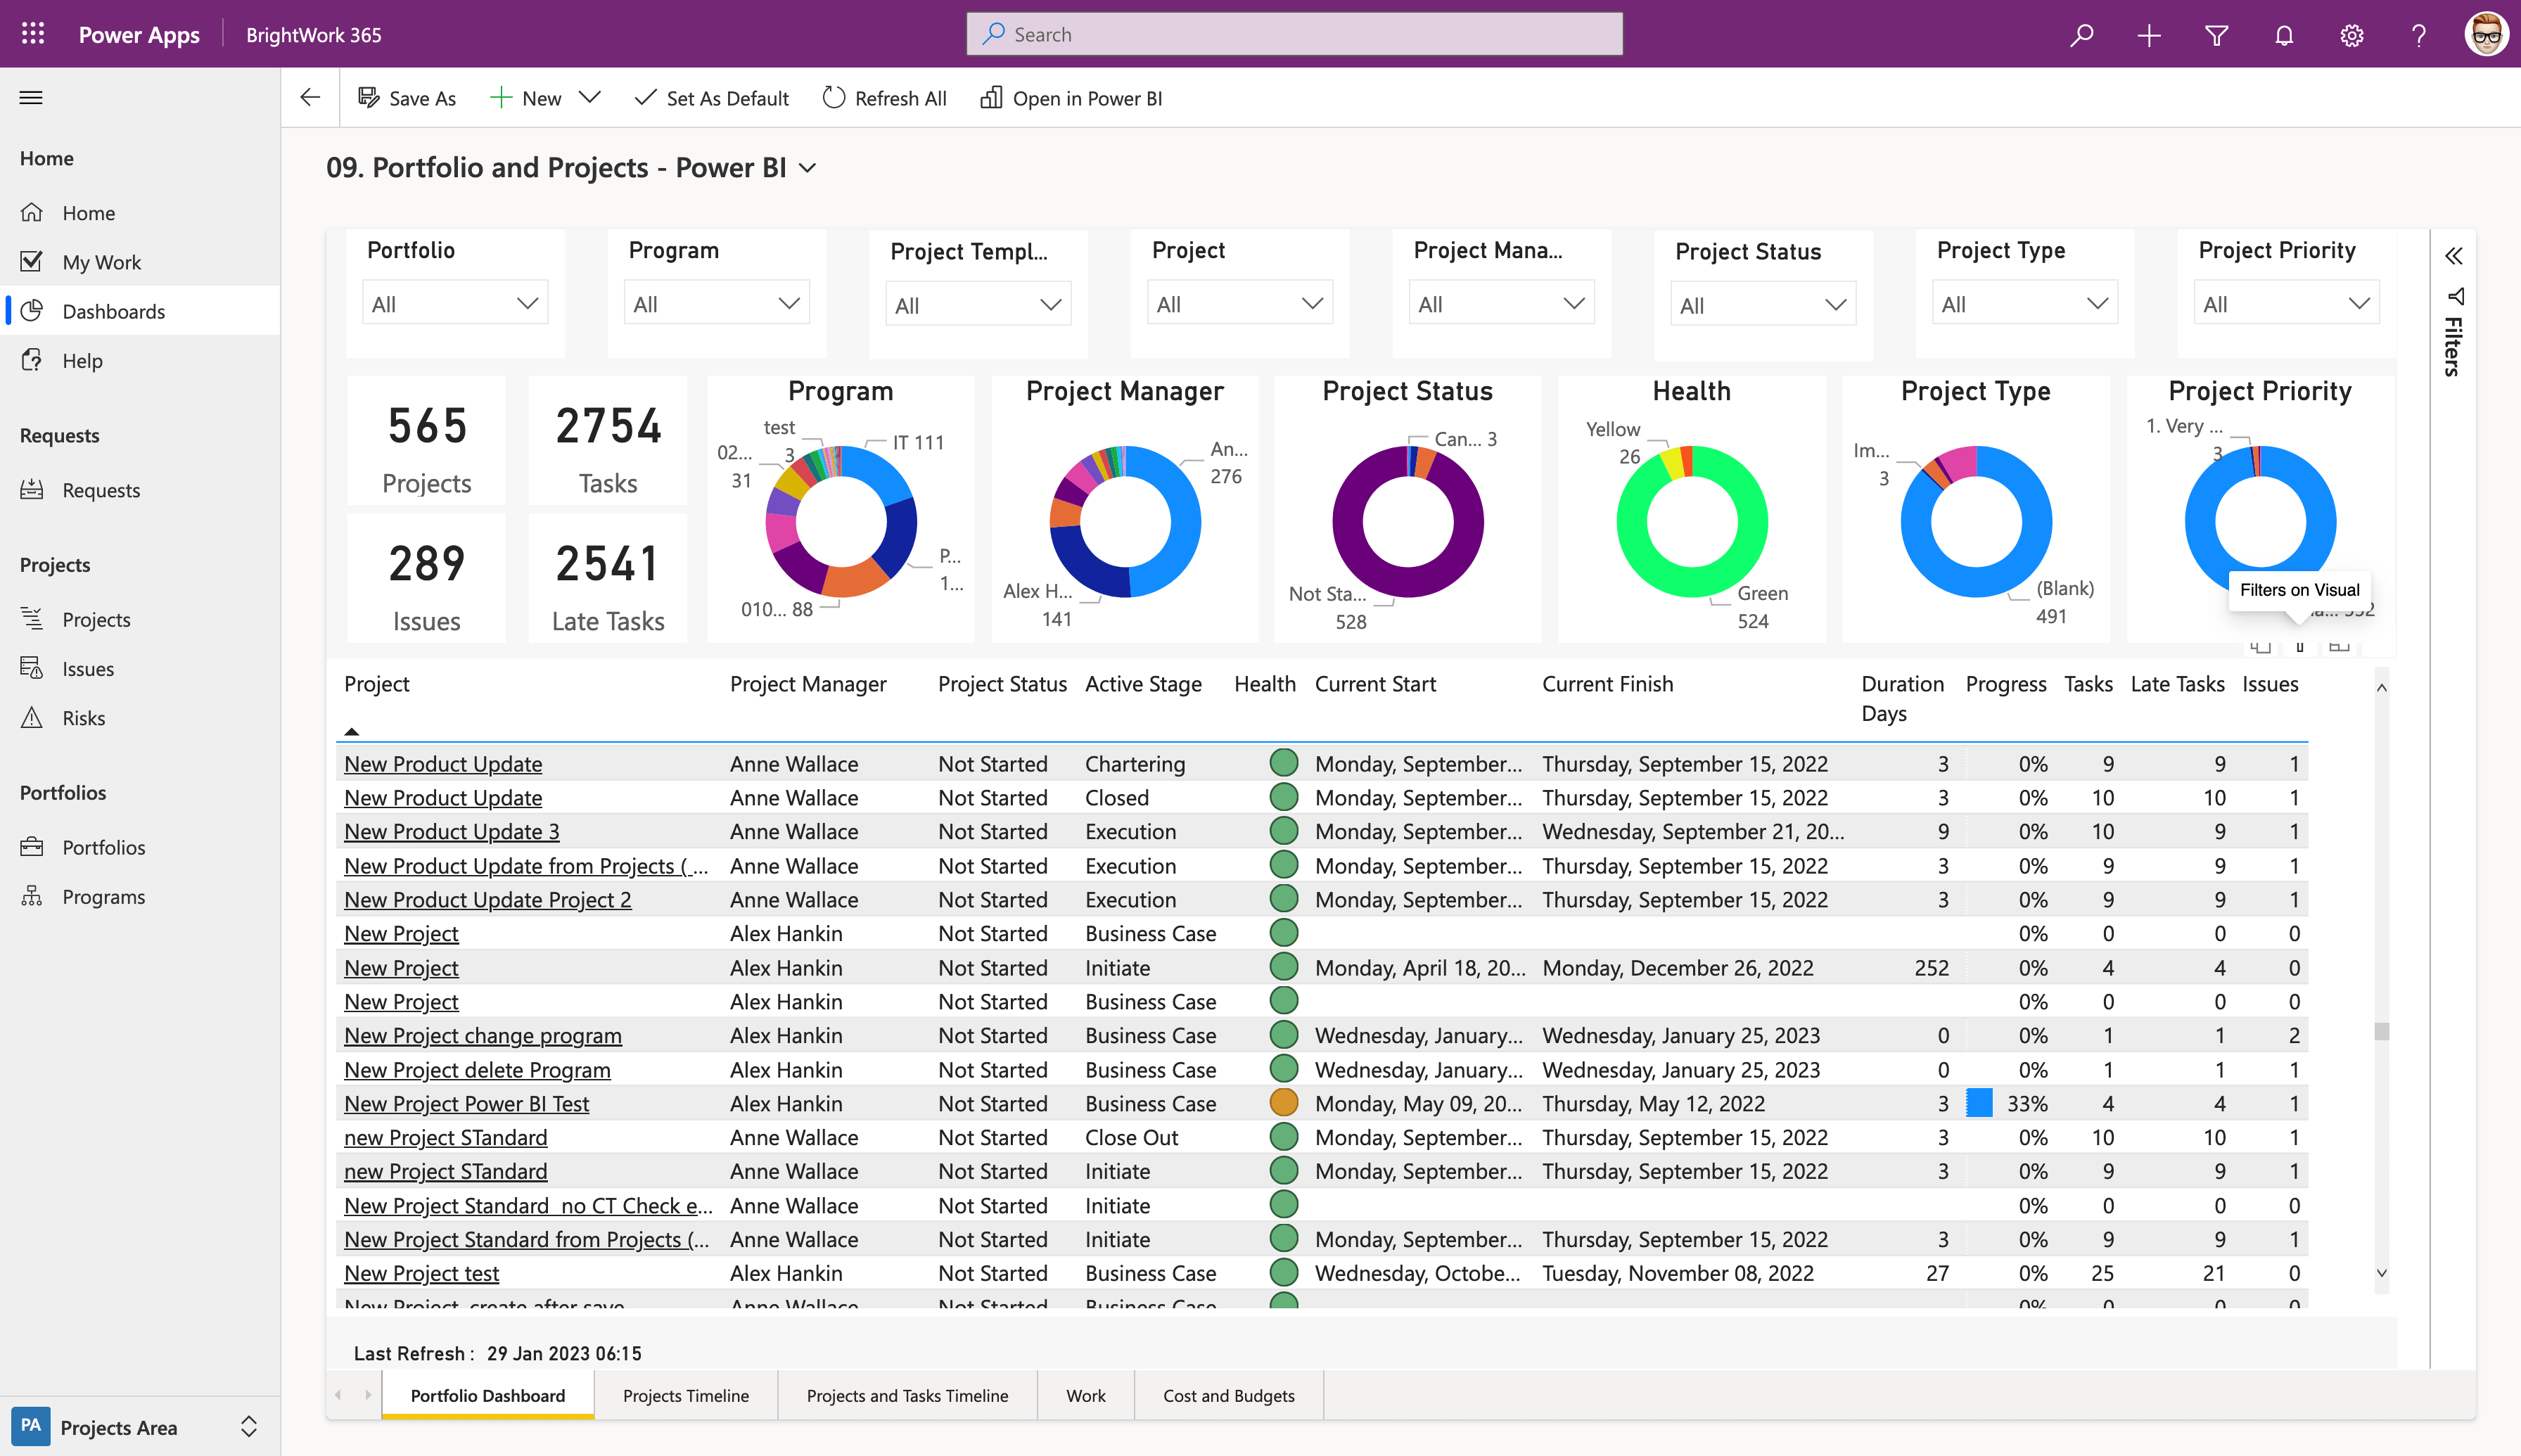
The Power BI Reports dashboard includes detailed interactive reports related to various elements of the system including Portfolios, Programs, Templates, Projects, and Project Managers.
Power BI Online
BrightWork 365 together with Microsoft Power BI Online offers additional options to interact with reports.
It allows you to view, download, and share the reports with your teams with email and Microsoft Teams channels.
