
What is a Project Metric?
A project metric measures progress or performance in a specific area. These metrics help track and evaluate a project’s progress against its goals and success factors.
Metrics assess how a project performs over time using these measures. A metric is not the same as a key performance indicator.
A key performance indicator (KPI) measures a specific metric related to business goals. Tracking KPIs helps teams to understand their efforts towards a particular goal.
Examples of project metrics include:
-
The estimated cost of the project.
-
The number of issues that are late.
-
The number of open tasks.
-
The duration of a project
-
Earned Value.
Why Should You Use Project Metrics for Reporting?
Project metrics are a very efficient way to assess the health of a project and make informed decisions. They show how the project is doing relative to the key performance indicators that have been selected.
This makes it very easy to identify the areas of a project that require attention. Metrics are an early warning system and should be actionable!
Using the Microsoft 365 SharePoint tools to manage and report on project metrics enhances visibility and ensures that critical data is always up to date. Here’s an example.
-
Project team members execute their work and update their project progress on the collaborative project site.
-
If a change triggers a warning metric, for example, a new issue, that indicator will automatically update on all the dashboards reporting on that metric.
-
As a project manager, you come into the project site. The KPIs will automatically light up with color-coded indicators: green, amber, or red. This will immediately show you if something is wrong on the project dashboard.
-
You can resolve issues promptly, restore metrics back to optimal status, and then repeat the cycle.
4 Ways to Report Project Metrics with BrightWork for SharePoint
BrightWork gives you the ability to track project metrics in SharePoint using a ‘Project Metrics List’. This feature allows you to calculate metric values, define target, warning, and danger ranges, and assign traffic light indicators to metrics for easy monitoring.
You can display these metrics in your BrightWork project management site using the following methods: There are a few ways to display metrics on your SharePoint site, including:
-
Metric Tiles.
-
Metrics Scorecard.
-
KPIs and Metrics at the Project Office Level.
Using Power BI? The BrightWork Power BI Pack for Microsoft SharePoint is ideal for reporting across project and portfolio sites. Let’s take a closer look at each element.
1. Metrics Tiles
The ‘Metric Tiles’ web part is a customizable, simple way to display metrics anywhere on your project site for increased visibility, such as the homepage.
Options include % Complete, Open Issues, and Project Completion Dates. The tiles automatically update as project site information changes.
This short video shows metric tiles in action, including configuration options.
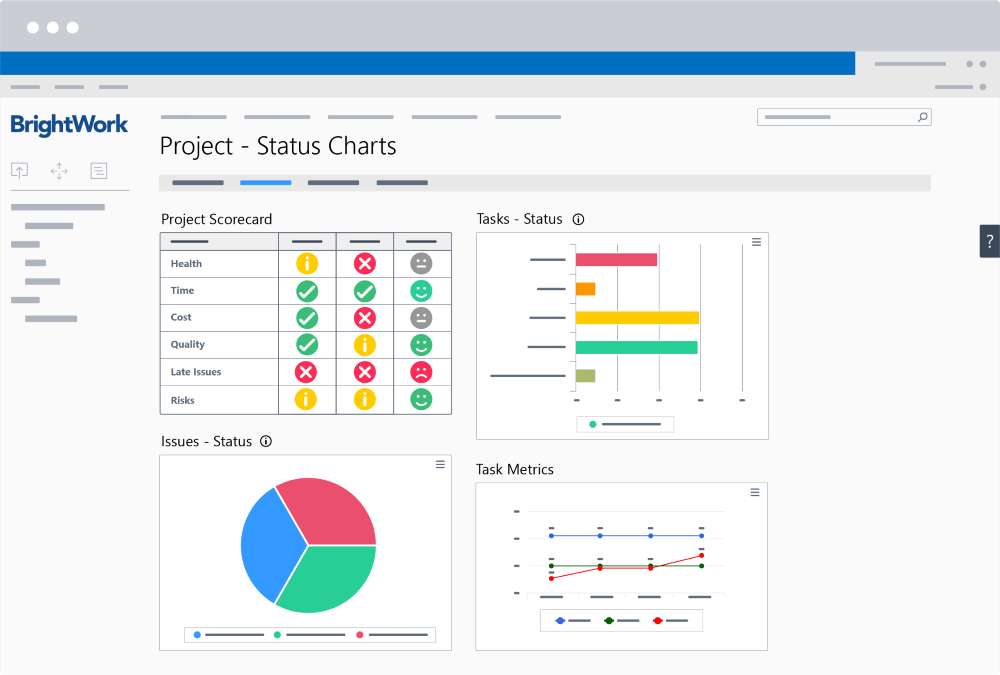
2. Metrics Scorecard
Project metrics help track project costs, issues, and risks, offering a clear picture of the current status. But they only tell you what is happening “right now.”
As the project manager or project stakeholder, you want to know where you come from as well. A metrics scorecard captures this historical data needed to track progress and performance.
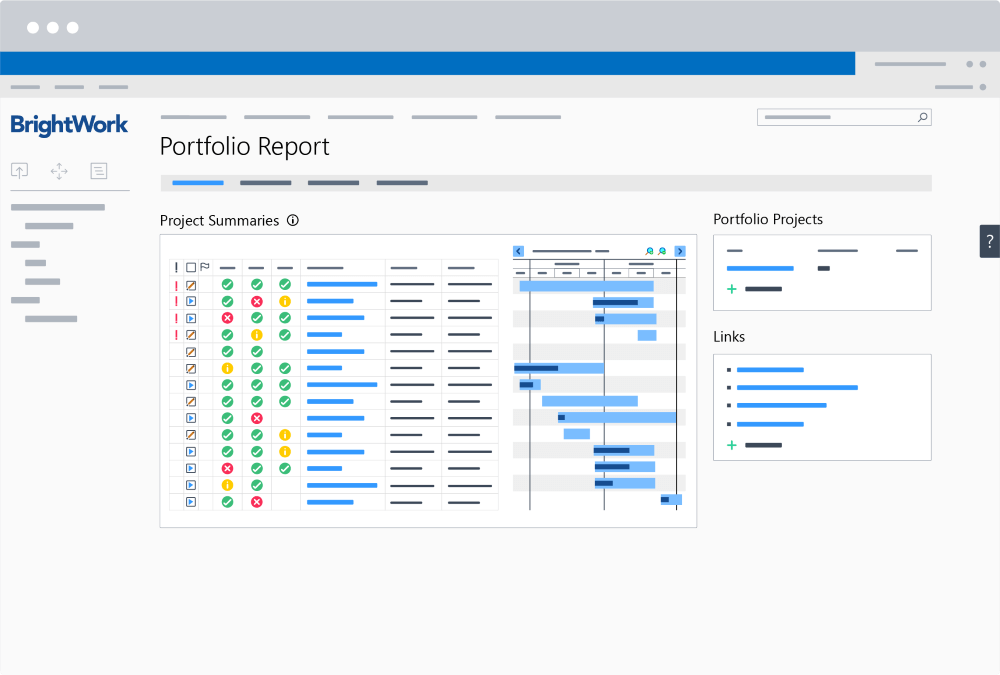
3. Metrics and KPIs at the Project Office Level
The beauty of BrightWork in SharePoint is that you can consolidate metrics from individual project sites and create portfolio-level reports.
This feature allows you to assess how the overall portfolio is doing and dig into the project details if necessary
4. BrightWork Power BI Pack
The BrightWork Power BI pack for SharePoint has project reporting templates pre-built with six dashboards.
It integrates data from three BrightWork project data sources – Project Cache, Work Cache, and Project Status Report Cache. This setup provides comprehensive insights into projects and portfolios.
What are the Main Features of the Power BI Pack?
Aimed at senior executives and project managers, the Power BI pack includes:
1. Portfolio Dashboards
These dashboards present a roll-up summary of all project sites. Users can use the filtering options: Project Status, Project Manager, Project Type, Department, or Priority.
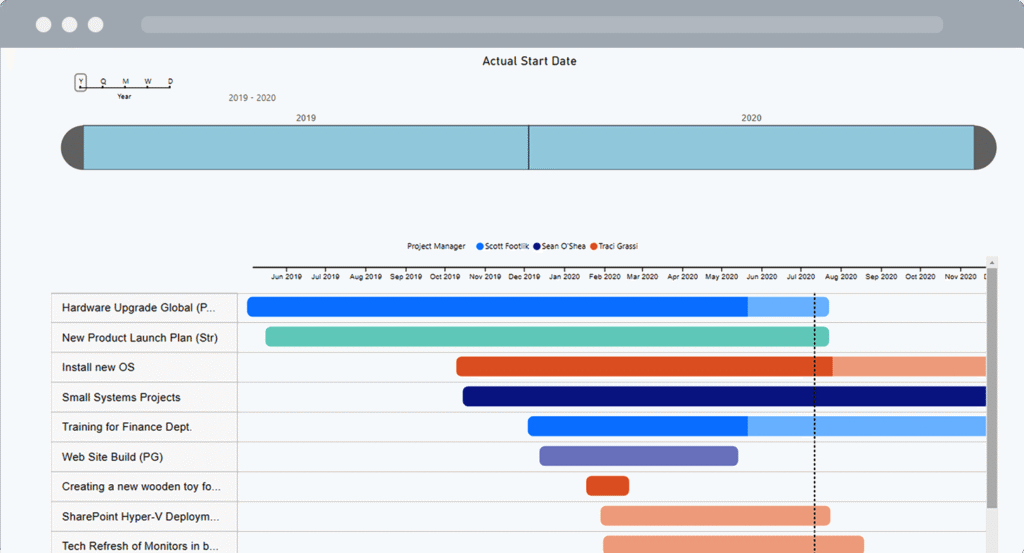
2. Portfolio Timeline
The timeline offers a Gantt chart view of all project sites. Users can explore details by year, quarter, month, week, or day.
3. Project and Task Timeline
This Gantt chart focuses on tracking projects and tasks. Filters include project name, project type, project manager, and task owner.
4. Work Reports
These reports can be customized to fit the needs of your SharePoint project. It also allows project managers to check the status of project tasks, risks, issues, and goals.
5. Status Report Dashboard
This dashboard includes RAG indicators, weekly updates, highlights, lowlights, and next steps for easy progress tracking.
6. Issue Report
The Issue Report helps project managers get further information on project issues, including the task-owner.