

Key Take Aways
Learn how business intelligence (BI) can help organizations gain insights from their data and improve project outcomes.
The article explains that BI is a set of concepts, methods, applications, and technologies that are used to transform raw data into meaningful information that can be utilized by stakeholders to make informed decisions. BI helps organizations consolidate data from internal and external sources, clean and analyze that data, and generate insights to drive change.
The article also highlights how Microsoft Power BI, a popular BI platform, can be leveraged for project reporting. The article is divided into the following sections:
Introduction
What is Business Intelligence (BI)?
How to Apply BI to Project Portfolio Management?
Business Intelligence Software: Power BI
The article provides a comprehensive overview of BI and its applications in project management. It also offers insights into how organizations can leverage Microsoft Power BI for project reporting with Microsoft 365.
What is Business Intelligence (BI)?
Business intelligence refers to “a set of technological processes for collecting, managing, and analyzing organizational data to yield insights that inform business strategies and operations.”
Introduction
What is Business Intelligence (BI)?
How to Apply BI to Project Portfolio Management?
Business Intelligence Software: Power BI
The article provides a comprehensive overview of BI and its applications in project management. It also offers insights into how organizations can leverage Microsoft Power BI for project reporting with Microsoft 365.
How BI Supports Organizations
BI helps organizations consolidate data from internal and external sources, clean and analyze that data, and generate actionable insights to drive change.
Research on BI and analytics adoption shows its importance for business executives and key stakeholders.
These processes enable organizations to comprehend their business strategy better, increase the quality of managerial decisions, and consequently improve their performance.
The Three Areas of BI
BI is divided into three areas, each offering increasingly sophisticated analysis and insights.
Descriptive analytics – It tells users what has happened and what is happening now. Examples include inventory tracking and annual benchmarking. Typically, this form is aimed at non-technical users and relies on visualizations.
Predictive analytics – Uses various techniques like data mining and statistics to predict what could happen.
Prescriptive analytics – Utilizes AI and machine learning to help users select the best course of action from a set of choices.
BI Processes and Goals
Business intelligence encompasses several processes depending on goals and objectives. These include:
Data mining – Used to find trends and usable data in large datasets.
Data preparation – Compiling data from internal and external sources for analysis.
Data cleaning – Fixing incorrect, corrupted, duplicate, incomplete, or incorrectly formatted data within a dataset. This step ensures that data is high-quality and reliable.
Data visualization – Transforming data into easy-to-consume charts, graphs, and dashboards.
Reporting – Sharing data analysis with stakeholders to review. Unlike traditional reports, BI software generates rich, interactive reports based on more data sources and context.
The Evolution of BI Tools
The field of business intelligence has undergone a significant transformation with the advent of self-service BI platforms. Tools like Microsoft Power BI democratize data analysis, breaking down the barriers that once restricted BI to IT departments and data specialists.
Research on the impact of BI tools in the educational sector underscores these tools’ transformative impact on various organizations, empowering a broader range of professionals to engage with BI technology.
The intuitive interfaces of modern business intelligence tools allow for complex data manipulation without extensive technical knowledge, making advanced analytics accessible to all.
Importance of Business Analysts
Despite the increased accessibility of BI tools, business analysts remain essential. They possess a deep understanding of the business domain and the technical capabilities of BI systems.
Business analysts configure and manage BI platforms, ensuring they are tailored to the organization’s needs. They also tackle complex data challenges, translating patterns into strategic insights.
Their expertise in aligning business requirements with data analysis is invaluable for maximizing the potential of BI.
Benefits of Business Intelligence
BI enables organizations to put their data to good use. It enables data-driven decisions and improvements in various areas:
Make better decisions based on past and current data.
Increase revenue with a better understanding of risks and opportunities, customer behavior, and competitors.
Improve strategic project plan.
Understand the context of KPIs and results.
Standardize data management and analysis throughout the organization.
Drive change and improve business
Find and reduce inefficiencies.
Improve communication with stakeholders and teams.
How to Apply BI to Project Portfolio Management?
Projects and portfolios generate vast amounts of data, from task duration and costs to customer feedback and risks. To effectively manage these aspects, it’s essential to understand which project management requirements are critical for success, as they can be complex and highly variable.
As a project or portfolio manager, you’re likely familiar with the effort involved in collating and analyzing project data from different sources. This is a vital part of the project management tasks.
Often, these reports are static – if a stakeholder has further questions, you’ll need to spend more time tracking down the answer.
Enhancing Visibility with BI
Business intelligence helps project and portfolio managers get visibility into the project with a clear picture of the current status and how the project is trending overall.
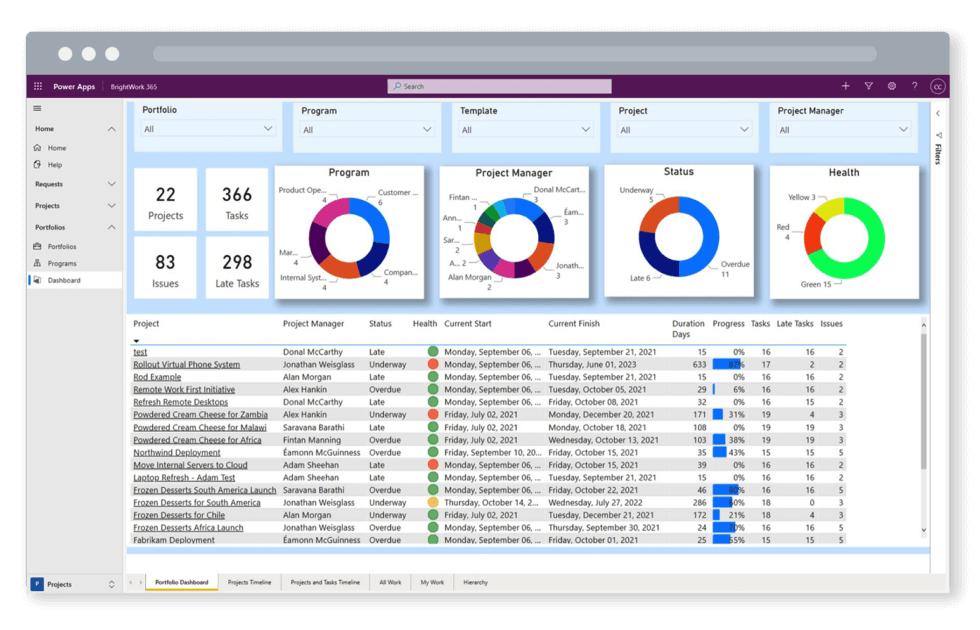
Drill-down dashboards allow stakeholders to dive deeper into individual projects, eliminating follow-up reports and emails.
An example of a roll-up dashboard in Microsoft Power BI. As data is automatically loaded into your software and cleansed before reaching end-users, reports are more accurate and up-to-date than spreadsheets or presentation decks.
Standardization and Cross-Functional Projects
Integrating business intelligence into project portfolio management not only streamlines workflows but also brings a new level of standardization to reporting across diverse projects.
This standardization is vital for cross-functional project teams, where consistency in data reporting ensures that all stakeholders, regardless of their departmental focus, are on the same page.
BI tools allow project managers to customize dashboards to monitor various key performance indicators (KPIs) and metrics that tie project outcomes with strategic business objectives. These metrics can include:
Resource allocation and availability – Track the distribution and utilization of resources across projects to optimize workload and prevent burnout.
Milestones – Monitor the percentage of milestones missed or delivered on time, providing insight into project pacing and team efficiency.
Planned vs. actual task duration – Compare projected timelines against actual progress to identify areas where efficiency can be improved.
Stakeholder satisfaction – Gauge the contentment of stakeholders with project outcomes, which can serve as a leading indicator of project success.
Percentage of overdue tasks – Keep an eye on tasks past their due date, which can signal potential bottlenecks or resource issues.
Risks – Assess and manage potential risks proactively, ensuring that contingency plans are in place and minimize risk exposure.
Budgets – Monitor project budgets in real-time, allowing immediate adjustments to meet financial objectives.
Benefits for Project Managers and Teams
Benefits for Project Managers and Teams
Using Power BI for project management empowers project managers and teams with a clear view of project timelines, active tasks, and potential risks, ensuring teams stay on track and address challenges proactively.
Project Timeline Visualization: Keep track of the entire project timeline for effective management.
Active Items and Tasks Monitoring: Stay updated on all functional items and tasks within the project.
Comprehensive Project Status Reports: Generate detailed reports on the project’s current status.
Issues and Risks Tracking: Identify and manage potential risks and problems in real time.
BrightWork 365 Power BI Dashboards
Using Power BI dashboards and reports, BrightWork 365 helps senior executives and PMO leads easily access, analyze, and action this data. The Power BI pack, designed for senior executives and project managers, includes:
1. Portfolio Dashboards
It provides a roll-up summary of all project sites. The dashboard offers five filtering options:
Project Status
By Project Manager
By Project type
By Department
By Priority
2. Portfolio Timeline
The Portfolio Timeline displays a Gantt view of all project sites. Drill down by year, quarter, month, week, and day.
3. Project and Task Timeline
The Project and Task Timeline shows a Gantt view of projects and tasks. Filter by project name, type, manager, and task owner.
4. Work Reports
It allows project managers to check the status of tasks, risks, issues, and goals.
5. Status Report Dashboard
The Status Report Dashboard features RAG indicators, weekly updates, highlights, lowlights, and next steps.
6. Issue Report
The Issue Report helps project managers get further information on issues, including the task-owner.
Achieve Project Excellence with BrightWork 365
Incorporating Business Intelligence into your project management strategy drives efficiency, fosters data-driven decisions, and ensures your projects stay aligned with strategic goals.
BrightWork 365 helps project managers and executives gain valuable insights, streamline reporting, and optimize project outcomes. Get in touch to see how we can support your business’s growth and drive project success.
This post was originally published in December 2020 and has been updated for freshness, accuracy, and comprehensiveness.