Overview
Recognizing project characteristics is very important to having a successful approach to project management. Before developing and implementing strategies, it’s helpful to establish a shared understanding of key project characteristics.
This article covers project characteristics, constraints, and the differences from business operations. It also explores project types, management strategies, and how the BrightWork Start-Evolve approach enhances project success with software and templates.
Get the Collaborative Project Management Handbook
Improve your leadership, collaboration, and project management skills with “Collaborative Project Management: A Handbook” written by Éamonn McGuinness.

6 Common Characteristics of a Project
The Project Management Institute (PMI) defines a project as a temporary effort aimed to create a unique product, service, or result.
But how can you tell if you’re dealing with a project? Here are six common characteristics of a project:
- A project is typically for a customer.
- The project is temporary in nature. It has a defined start and a defined end-point.
- The project will have a unique set of requirements that need to be delivered within the boundaries of this project.
- A project can typically be more of a one-time undertaking, not a recurring activity.
- A project is not ‘business as usual,’ which is more akin to a process.
- A project can very often be cross-functional or, indeed, cross-organization.
What are the Types of Project Constraints?
You will also find that every project often faces conflicting constraints. Here are four typical constraints to watch out for:
- Scope – defines the needs that the customer has or the requirements expressed and implied.
- Time – a project is usually required by a customer by an agreed date.
- Quality – to what standard is the project expected to deliver?
- Resources – the amount of money, budget, or resources that are available to be expended on the project.
Examples of Project Constraints
It’s obviously not possible to fix and agree on all four of these constraints as the project starts, which is why they’re called conflicting constraints.
For example, it wouldn’t be possible for you to deliver forty new features or requirements in your project in one year of time to perfect quality with one person if the last time you did it, it took four years.
Identifying Fixed Constraints
Listening to customers and asking questions helps identify which constraints are really critical and, therefore, fixed.
- Do all the project requirements have to be delivered?
- Is delivering a significant portion by the end of the year more important than completing everything?
- Or is it that you need to do as much as you can with four people and a hundred thousand dollars?
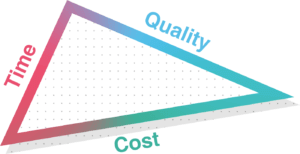
This is often called the time–quality–cost triangle. Each side of the triangle represents one constraint, and you elongate or shorten each of the sides until they form a triangle. So, you may be fixing one of the constraints and adjusting the other two to match.

Managing Constraints at BrightWork
If I use an example close to home, at BrightWork, we release a new product to our customers about three to four times per year.
The release schedule is fixed at three to four months, and the quality must meet a high standard to ensure ease of use. It’s not appropriate or right to ship in poor quality.
Given these fixed constraints—time and quality—the scope of functionality becomes variable. We try to fit in as much capability as we can in each release, but it has to be done in a certain amount of time and with a very high degree of quality.
What is the Difference Between Projects and Operations?
Projects and operations are two different types of activities that organizations engage in to achieve their strategic goals. The main differences between projects and operations are:
Temporary vs. Ongoing
A project is temporary with a defined start and end date, while operations are ongoing activities that are part of the day-to-day activities of an organization.
Unique vs. Repetitive
Each targets a specific, unique project goal different from routine operations. Operations, on the other hand, are repetitive, with activities that are performed on a regular basis.
Scope vs. Continuity
Projects have a specific scope that defines what is included and excluded from the project, while operations focus on sustaining organizational activities.
Resources vs. Capacity
Projects require specific resources to achieve their objectives, such as people, time, and budget. Operations rely on sustained resource capacity for ongoing processes.
Risk vs. Stability
Projects are often associated with risk, as they involve a degree of uncertainty and may encounter unexpected challenges. Operations are generally more stable, focusing on maintaining consistent performance and minimizing risk.
What are the 8 Most Common Project Types?
Projects can be classified into different types based on their characteristics, objectives, and deliverables. Project types can also be classified based on their complexity, scope, size, or duration.
Identifying the type of project is critical to developing an effective project plan and ensuring successful project outcomes. Here are eight common types of projects:
1. Construction Projects
Projects involving the construction of buildings, bridges, roads, and other physical structures.
2. Information Technology (IT) Projects
Projects involving the development and implementation of software, hardware, and networking systems.
3. Marketing and Advertising Projects
Projects involving the development of marketing and advertising campaigns, branding initiatives, and product launches.
4. Research and Development (R&D) Projects
Projects involving the development of new products, services, technologies, or the improvement of existing ones.
5. Event Management Projects
Projects involving the planning and execution of events such as conferences, trade shows, and festivals.
6. Organizational Change Projects
Projects involving the implementation of organizational changes, such as mergers, acquisitions, or restructuring initiatives.
7. Process Improvement Projects
Projects involving the improvement of existing processes to enhance efficiency, reduce waste, and increase productivity.
8. Social And Community Projects
Projects involving the development of social and community initiatives, such as charitable programs, community service projects, and public welfare campaigns.
Why are Project Characteristics Important?
Recognizing project characteristics allows project managers to address the unique needs and challenges of each project. Here are some reasons why understanding project characteristics is important:
Helps to Identify Project Objectives
Project managers can identify the objectives they want to achieve, which helps define the project scope and determine the necessary resources.
Determines Project Complexity
It helps project managers determine the level of complexity involved, which can help them plan and allocate resources accordingly.
Enables Better Risk Management
They can identify potential risks and plan for them in advance, which can help in reducing the impact of any potential issues.
Determines the Project Team
Project characteristics can also help determine the skills and expertise required to successfully execute the project, which can help select the right team members.
Informs the Right Project Management Approach
Different projects require different project management approaches and help in selecting the most appropriate approach.
Standard Approaches to Project Management
Various project management methodologies can guide your projects. Each framework offers distinct principles, processes, and practices.
Choose the right methodology based on the project characteristics, stakeholder requirements, and organizational culture. Here are some standard methodologies:
1. Waterfall Methodology
A linear, sequential approach where each phase is completed before moving on to the next one. This methodology is most suitable for projects with a clearly defined scope, predictable outcomes, and well-established processes.
2. Agile Methodology
Agile methodology is an iterative, incremental approach emphasizing flexibility, collaboration, and responsiveness to change. This methodology suits projects with changing requirements, evolving technologies, or uncertain outcomes.
3. Scrum Methodology
Scrum Methodology is a framework within the Agile methodology that focuses on delivering value in short sprints, with a cross-functional team working collaboratively to deliver the product incrementally.
4. Kanban Methodology
A lean approach that emphasizes visualizing work, limiting work in progress, and managing flow. Best for projects focused on continuous improvement and maximizing efficiency.
5. Lean Methodology
A continuous improvement approach that focuses on maximizing value and minimizing waste by identifying and eliminating non-value-added project activities.
6. PRINCE2Methodology
A process-based framework for planning, executing, monitoring, controlling, and closing projects.
7. PMBOK Methodology
A guide developed by the Project Management Institute (PMI) that outlines the standard processes, practices, and knowledge areas for project management.
8. Six Sigma Methodology
A data-driven approach to quality management that uses statistical methods to identify and eliminate defects in the project.
9. Hybrid Project Management
Hybrid project management combines the best practices of both traditional and agile methodologies to create a customized project management framework that meets the specific needs of a project.
Get your projects under control with project management templates for Microsoft 365.

Spectrum of Project Management
At BrightWork, we like to think of project management as a spectrum. This approach guided our template-based project management on SharePoint, Microsoft 365, and BrightWork 365.
Sometimes, your project might be quite small, or it may be a project you find very easy to deliver, as you have done it many times before. In these scenarios, it doesn’t make sense to deploy a very large amount of project management.
Often, your team may not be ready to use a large amount of collaborative project management. Project complexity and team readiness both influence the level of project management needed.
Four Levels of Project Management
The spectrum consists of four sections:
- Ultra Lite
- Lite
- Standard
- Structured

These sections represent different and increasing amounts of project management. The arrows on both ends show that your approach can shift.
For example, a project might start at Lite and later move to Ultra Lite or shift towards Standard, depending on the changing needs of the project.
The 7 Benefits of Using Project Management Software
Now that you understand the characteristics and constraints facing a typical project, it’s time to think about how you will manage the work!
Project management software provides a wide range of benefits for project management, such as:
1. Planning and Scheduling
Create project timelines, assign tasks, and set deadlines with ease.
2. Resource Management
Track and allocate resources such as people, equipment, and budget efficiently.
3. Collaboration and Communication
Enhance teamwork through messaging, file sharing, and project updates.
4. Progress Tracking
Provide real-time updates on task completion, milestones, and overall project progress.
5. Risk Management
Identify, assess, and mitigate project risks using specialized tools.
6. Reporting and Analysis
Provide data on project performance, resource utilization, and other metrics.
7. Integration with Other Tools
Seamlessly connect with other tools, such as accounting, collaboration, and customer relationship management (CRM) software, to streamline project management processes.
Fast-Track Your Projects with Management Templates
If a project management solution is already used within your organization, start there.
If not, check if Microsoft 365, the productivity suite and collaborative platform from Microsoft, is available. BrightWork 365 is a project portfolio management (PPM) solution that integrates with Microsoft 365 platform.
With BrightWork 365, you can:
- Manage projects with Microsoft 365, Teams, SharePoint Online, and the Power Platform
- Control portfolios with Power BI dashboards
- Improve project management processes with project management templates for Microsoft 365
- Get an efficient start and adoption with scalable processes with our deployment approach: Start-Evolve
Manage Projects with Microsoft 365, Power Platform, and Teams
Collaborate seamlessly from anywhere, with BrightWork 365 and Microsoft Teams.


