
Introduction
Pairing Power BI with SharePoint transforms project and portfolio reporting into a structured, real-time experience inside your Microsoft 365 environment.
BrightWork enables project managers, executives, and PMOs to move from reactive updates to proactive planning; all within a familiar Microsoft toolset.
For companies managing projects in SharePoint, this combination offers a straightforward way to get better visibility and control. Project managers, executives, and PMOs can shift from putting out fires to planning ahead, all inside the familiar Microsoft ecosystem.
This article explains how the Power BI and SharePoint integration solves common reporting problems and gives you a complete picture of project health.
Key Takeaways
-
Power BI Solves SharePoint Reporting Limitations
Traditional SharePoint reporting often involves manual data consolidation and lacks real-time visibility. Power BI integration centralizes data and automates updates, enabling faster, more informed decisions. -
BrightWork Power BI Pack Offers Ready-to-Use Dashboards
The pack includes pre-built dashboards for project status, timelines, risks, and resource allocation, eliminating the need for custom development and accelerating value delivery. -
Interactive Visuals Enhance Project Oversight
Power BI transforms static SharePoint lists into dynamic visuals with drill-down filters, helping project managers and executives quickly identify issues and track performance. -
Secure and Seamless Integration with Microsoft 365
Power BI respects SharePoint permissions, supports row-level security, and uses encrypted data gateways for on-premises environments, ensuring secure, compliant reporting. -
BrightWork 365 Extends Reporting Across Microsoft Tools
Built on Microsoft 365, BrightWork 365 integrates with Teams, Planner, and Power Automate to create a unified, scalable project management environment.
Why Traditional SharePoint Reporting Creates Bottlenecks
Many project managers and PMOs who rely solely on SharePoint struggle with limitations in reporting visibility and control.
These issues can slow down decisions and hide important performance trends by introducing the following roadblocks:
Manual Data Consolidation
Project information is often scattered across multiple sites, lists, and spreadsheets. Teams must manually copy and paste data, which consumes valuable hours that could be better spent on project strategy.
Lack of Real-Time Visibility
Reports are typically snapshots pulled weekly or monthly, meaning decisions are based on outdated information. This delay leads to slow reactions to new risks and missed opportunities to correct a project’s course.
Difficulty in Portfolio Oversight
Getting a clear, combined view of the entire project portfolio is a constant struggle. This makes it challenging to assess portfolio health, identify dependencies, or analyze resource allocation at a high level without extensive manual work.
Unifying Project Data with Power BI and SharePoint
Integrating Power BI with SharePoint, both Server and Online, is a strong solution to these reporting headaches. It creates a single source of truth by linking dynamic visualization tools directly to your project data.
Instead of exporting data, this direct connection enables continuous reporting. BrightWork’s pre-configured Power BI Pack ensures SharePoint On-Premises users can centralize project data without custom builds.
Centralizing Project Information
This integration works by connecting Power BI directly to your SharePoint lists and libraries. These lists become a live data source for all your project and portfolio details, from task deadlines and budgets to risks and issues.
Instead of exporting data, the connection gives you direct and continuous access. For organizations using SharePoint on-premises, the BrightWork Power BI pack for SharePoint On-Premises provides a pre-configured solution to set up this central data hub without a lot of setup time.
From Static Lists to Interactive Visuals
SharePoint lists are great for collecting data, but they don’t offer much for visualization. Microsoft Power BI turns this raw data into rich, interactive dashboards. Users can go beyond static tables and work with dynamic charts, graphs, and maps.
These visuals enable stakeholders to filter information, drill down into specific details, and view project metrics from different angles. This interaction helps find trends and insights that would stay hidden in a standard list.
Automating Report Generation
A huge benefit of the Power BI and SharePoint integration is automated report generation. You can schedule data refreshes at set times, such as daily or hourly.
For SharePoint Server, the On-Premises Data Gateway encrypts data during transfer to Power BI. This ensures on-prem data remains secure and up to date within cloud-hosted dashboards.
The BrightWork Power BI Pack – A Ready-to-Use Solution
BrightWork Power BI Pack eliminates the need to build custom dashboards from scratch. With ready-to-use templates for SharePoint On-Premises or Microsoft 365, teams can start visualizing project and portfolio data instantly.
It includes a set of ready-to-use dashboards and reports made specifically for project and portfolio management in SharePoint.
Pre-Built Project Dashboards
The pack comes with a collection of Power BI Reports designed for common project management needs. These dashboards are ready to go, letting project managers quickly visualize project status, timelines, and workloads.
This means you can skip a long development process and get immediate value for your project team.
Comprehensive Portfolio Reports
For PMO leads and senior executives, the pack offers reports that give a high-level view of the entire project portfolio. These dashboards pull together data from all projects, making it simple to: Monitor overall portfolio health and Track performance against strategic goals. Spot system-wide issues
This complete oversight supports better strategic planning and resource management across the company.
Customizable to Your Needs
Every organization has its own reporting needs. While the BrightWork Power BI Pack is ready to use out of the box, it is also fully customizable.
With help from our expert Power BI consultants, the dashboards and reports can be adjusted to match your specific business processes, KPIs, and branding. This flexibility ensures the solution perfectly fits your organization’s requirements.
Visualizing Project Health and Timelines
The BrightWork pack provides specific project-level dashboards that give project managers the detailed views they need. These visualizations make it easy to:
Track progress
Spot potential problems
Communicate status to stakeholders
Each dashboard surfaces key insights with drill-down filters, helping project managers answer critical questions around budget, schedule, risk, and project health.
The Project Timeline Dashboard
This dashboard shows a clear, Gantt-like view of the project schedule. It visualizes important tasks, milestones, and their dependencies over time.
Project managers can quickly see the critical path, find potential scheduling conflicts, and track progress against the plan. This visual layout of the schedule is much easier to interpret than a simple list of dates.
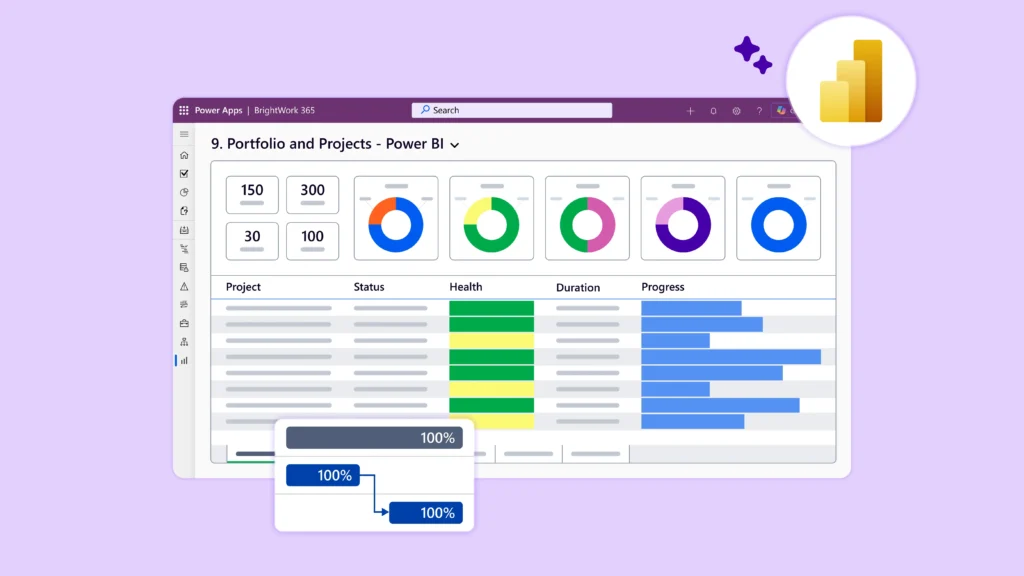
The Project Status Report
The Project Status Report is a one-page summary that shows the overall health of a project. It brings together primary performance indicators (KPIs) for budget, schedule, workload, and open issues into a single, easy-to-read format.
This report is perfect for stakeholder updates because it gives a quick but thorough assessment of where the project is, without getting lost in the details
The Active and Late Items View
To keep things moving, project managers need to stay on top of overdue tasks. This report helps by highlighting all active and late work items across their projects.
It lets managers quickly see which tasks are falling behind and find potential bottlenecks before they affect the schedule. This focused view supports proactive problem-solving and helps keep the project on track.
Achieving High-Level Portfolio Control
The BrightWork Pack includes interactive portfolio dashboards that allow executives to filter by department, status, or strategic alignment, making performance reviews faster and more informed.
The portfolio-level dashboards in the BrightWork pack give leadership the consolidated oversight needed for effective governance and smart decisions.
The Portfolio Timeline View
Much like the project timeline, this report shows the schedules of all projects in the portfolio on one timeline. This combined view is great for spotting dependencies between projects and potential resource conflicts.
For example, leaders can see if multiple high-priority projects have major deliverables due at the same time, allowing them to make adjustments ahead of time.
The Consolidated Portfolio Status
This dashboard rolls up the health indicators from every project into a single, high-level summary. It gives executives a quick read on the overall health of the portfolio, using color-coded indicators for status, budget, and schedule.
This allows leaders to instantly spot projects that are in trouble and need attention, without having to dig through individual reports.
Filtering for Specific Insights
The real advantage of these portfolio dashboards is their interactivity. Executives and PMO leads can filter the reports to get specific information.
For instance, before a departmental review, a director can filter the portfolio dashboard to show only projects in their department. Project manager, status, or any other custom metric can also filter dashboards.
This makes strategic meetings more productive and data-driven. To see these features in action, watch our on-demand webinar, SharePoint Project Reporting with Power BI.
How to Embed Power BI Reports in Your SharePoint Site
Once your reports are ready, embedding them into a SharePoint page gives your team easy access. Displaying a report on modern SharePoint pages is a simple, three-step process:
1. Publish Your Report
After creating your report in Power BI Desktop, publish it to the Power BI Web Service. This action makes the report available online and provides the options needed for sharing and embedding.
2. Generate the Embed Code
In the Power BI Service, open the report and navigate to the File menu. Select “Embed report,” then choose the “SharePoint Online” option to create a secure URL for embedding.
3. Add the Web Part
On your SharePoint page, enter edit mode and add the “Power BI” web part. In the properties pane, paste the report URL you copied to display the interactive dashboard directly on the page.
Ensuring Your Project Data Remains Secure
Integrating important business platforms naturally raises questions about data security, particularly with sensitive project information. The SharePoint and Power BI integration is built with security in mind, respecting the permissions and controls you already have.
SharePoint Server Security Features
Your data’s first line of defense is the solid SharePoint Server security model. Permission levels control access to sites, lists, and items.
Power BI respects SharePoint’s native permission levels. Viewers only see data they are authorized to access, ensuring reports remain secure and compliant with Microsoft 365 governance standards.
Power BI’s Data Protection Layers
Power BI adds its own layers of protection. A main feature is row-level security (RLS), which lets you limit data access for certain users based on their roles.
For example, a project manager could be set up to see only their own projects in a portfolio dashboard. Additionally, Microsoft provides comprehensive Power BI security through data encryption at rest and in transit, all supported by the security of the Microsoft cloud.
Secure Data Gateway for On-Premises Data
For organizations using SharePoint Server, a secure connection to the cloud-based Power BI Service is vital. This is done using the On-Premises Data Gateway.
The gateway acts as a secure bridge, encrypting and transferring data between your on-premises SharePoint environment and the Power BI Service. It ensures your project data remains protected as it moves to the cloud for reporting.
Evolve Your Reporting with BrightWork 365
BrightWork 365 is a cloud-based project and portfolio management solution built entirely on Microsoft 365. It provides teams with a scalable, structured, and integrated reporting environment using familiar apps like Power BI and Microsoft Teams.
The Next Step in Project Management
BrightWork 365 is the next step in project and portfolio management, built entirely on the Microsoft 365 platform.
This brand new project and portfolio management solution called BrightWork 365 offers a modern, integrated experience for teams that want to get the most from their Microsoft investment.
It provides a structured yet flexible way to manage projects directly in your cloud environment.
Deeper Integration with Microsoft 365
Because BrightWork 365 lives inside Microsoft 365, it connects smoothly with the tools your team already uses every day. This includes deeper connections with:
Microsoft Teams for collaboration
Planner for task management
Power Automate for workflow automation
This creates a single work environment where project management is a natural part of your team’s daily flow.
Get Started with a Free Template
Experience the BrightWork approach firsthand. See how structured templates can bring consistency and control to your projects.
Download a free SharePoint project management template to see how BrightWork simplifies SharePoint reporting.
Watch Our On-Demand Webinar
Learn more about optimizing your project management processes with powerful tools like Power BI and Power Apps. Watch our Optimizing Project Management with Power BI & Power Apps Webinar to see data-driven project management in action.