
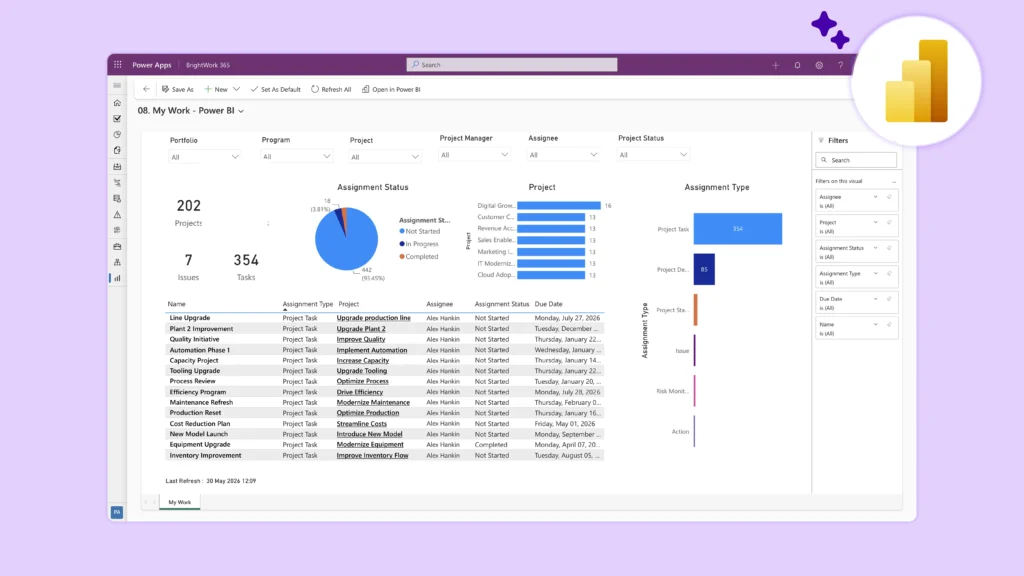
Plant teams, central PMOs, and executives need different views of the same governed project records. Power BI can present project health, milestones, costs, risks, actions, resource use, and portfolio trends when every site reports against common fields and definitions.
Keep each dashboard focused on project and portfolio work. Production throughput, quality, machine data, and ERP metrics belong in separate reporting streams. Include operational measures in project analysis only when an approved integration and clear data model support them.
What we’ll cover:
-
Why multi-site project reports become difficult to compare
-
Which project signals belong in manufacturing dashboards
-
How plant, PMO, and executive views should differ
-
What keeps reports current and credible after launch
-
Where BrightWork 365 and Power BI fit
Why Manufacturing Project Reports Become Hard to Compare
Manufacturers often run capital work, continuous improvement programs, product launches, compliance updates, site moves, and maintenance initiatives at the same time. Each facility may use its own spreadsheet, update cycle, status labels, and reporting habits.
Local flexibility creates a portfolio problem. A green project at one plant might meet a different standard than a green project elsewhere. Budget fields may show approved spend at one site and committed spend at another. Milestone dates can also come from plans with different levels of detail.
Power BI can bring records together, but it cannot correct unclear definitions on its own. PMOs and plant leaders need a common reporting contract that states:
-
Which projects enter the portfolio
-
Which fields every project must maintain
-
How health, schedule, cost, risk, and issue status are defined
-
How often owners update project records
-
Which date closes each reporting period
-
Who approves corrections
-
Which measures apply at project, program, site, and portfolio levels
Once that contract exists, project management standardization gives every site a consistent basis for comparing performance.
What a Manufacturing Project Dashboard Should Show
Useful measures depend on the decisions each reader needs to make. A plant manager needs to know what requires action this week. A PMO needs to identify incomplete updates and cross-project pressure. An executive needs visibility into financial and strategic exposure across sites and programs.
Several Power BI project management dashboards can support those decisions when each view draws from the same governed project model.
Project Health and Status
Health ratings give readers a compact view of the current delivery position. Define which schedule, cost, scope, risk, or issue conditions can change the rating. A dashboard can then show health by site, department, program, project type, or owner.
Status updates add context. A concise narrative should explain the cause, the current response, the decision required, and the next expected step. Keep the rating and narrative connected so readers can move directly from the signal to its cause.
Milestones and Schedule
Milestone views help teams identify upcoming commitments, missed dates, and work that may affect a launch, shutdown window, site handover, validation, or regulatory deadline.
Useful reports distinguish planned, current forecast, and actual dates when the source data supports those fields. They should also show who owns the next action. A red milestone without an owner warns the reader but offers no route toward resolution.
Cost and Budget
Project cost reports can compare approved budget, current forecast, committed cost, and actual cost when each field has a clear definition and reliable source. Do not assume the project system contains every financial figure.
Decide which records come from the project process and which originate in the finance system. When data moves between them, document the source of record, update timing, mapping rules, and reconciliation process.
Risks, Issues, and Actions
A portfolio count of open risks can hide the items that need immediate attention. A stronger report filters records by severity, exposure, owner, due date, site, project, and escalation status.
Connect actions to the risk, issue, milestone, or decision that created them. Plant leaders can then review overdue responses in context instead of working through an isolated action list.
Resources and Workload
Resource reports need a defined unit, source, period, and planning purpose. Headcount, assigned effort, availability, workload, and specialist demand answer different questions.
Each project resource management measure should match the planning decision behind it. Do not describe a project resource view as a plant-capacity report unless the source model contains approved production-capacity data.
Three Views From One Governed Project Model
Microsoft Power BI supports reports that reuse an existing semantic model across workspaces. Manufacturers can use shared semantic models to preserve common definitions while presenting tailored information for each audience.
Plant View: Act on Current Delivery
The plant view should help local leaders answer:
-
Which projects need action now?
-
Which milestone or issue creates the next operational constraint?
-
Which owner owes an update or response?
-
Which work affects the same shutdown, line, area, or team?
-
Which decisions need escalation?
Keep the opening view narrow enough for weekly use. Readers should be able to drill into project details, actions, and supporting records instead of facing every measure on one page.
PMO View: Compare and Govern
The PMO needs a cross-site view of reporting quality and delivery exposure. Useful filters include site, business unit, program, project type, project manager, health, status date, and reporting completeness.
The PMO can also track missing updates, inconsistent fields, overdue actions, unapproved requests, and portfolio changes. These controls support both data quality and delivery decisions.
Executive View: Decide Across the Portfolio
Executives need a smaller set of portfolio signals tied to funding, timing, risk, and strategic commitments. They should be able to move from a high-level total or trend to the sites, programs, and projects behind it.
The executive view should expose tradeoffs without replacing the governance discussion. A portfolio chart identifies where exposure sits. The meeting then decides what to fund, stop, reschedule, or escalate.
Keep Project and Production Reporting Connected but Distinct
Manufacturing leaders often want one management view across project work and operations. That request requires a clear data boundary.
Project management software for manufacturing should track planned change, including requests, milestones, costs, risks, issues, resources, and delivery status. Production reporting follows operating performance such as output, quality, downtime, scrap, maintenance, or equipment condition.
Both reporting streams can inform the same decision. A plant project may aim to improve yield or reduce downtime, and the business case may use production measures. The project dashboard still needs an approved source and model before it displays those operational metrics.
Never imply that a project portfolio product supplies ERP, MES, quality, or machine data. Combined reporting requires documented ownership and integration.
Define the Data Boundary Before Combining Reports
Specify:
-
The source system for each field
-
The business definition and unit
-
The update frequency
-
The join between operational and project records
-
The access rules
-
The owner who investigates mismatches
A documented boundary keeps the portfolio report useful without turning it into an unsupported production system.
Reporting Design Decisions That Matter After Launch
A manufacturing dashboard needs operating ownership after its initial release.
Refresh and Source Availability
Imported Power BI models rely on scheduled or on-demand refresh. DirectQuery sends requests to the underlying source when users interact with report visuals. Microsoft’s Power BI data refresh documentation explains the storage modes, dependencies, and refresh options.
Choose the storage mode and refresh pattern around the decision cycle. A weekly governance meeting and a daily plant action review usually need different timing.
Measure Ownership
Assign an owner to every portfolio measure. That person should approve the definition, source, calculation, and change process. Report credibility declines quickly when a measure changes without notice.
Access and Permissions
Plant, PMO, finance, and executive readers need different levels of detail. Configure workspace access, report sharing, semantic-model permissions, and row-level security around those requirements.
Test access with real user groups before release. An administrator’s successful test does not prove that plant managers, finance analysts, and executives can reach the correct records.
Change Control
New fields, plants, project types, and source systems will eventually change the model. Maintain a small release process for model, measure, permission, and report updates.
Record each change and inform users when a revised definition affects comparison with an earlier reporting period.
BrightWork 365 Reporting for Manufacturing Programs
BrightWork 365 supports manufacturing project reporting across milestones, tasks, status updates, costs, resource use, sites, and departments. Teams can organize those measures at project, program, and portfolio levels.
The solution provides the project and portfolio process behind the reports. Configurable templates, request intake, approvals, workflows, project updates, and governed fields create the structured records that Power BI needs.
BrightWork 365 connects structured project data with Power BI portfolio reporting across project, program, and portfolio views.
Manufacturers should still assess source systems, field definitions, audience needs, access requirements, and update routines before deployment. Packaged dashboards reduce some design work, but they still require configuration and governed inputs.
Power BI viewing and sharing options depend on the organization’s Microsoft licensing, permissions, and environment setup.
Common Questions About Manufacturing Project Dashboards
How Often Should Manufacturing Project Dashboards Refresh?
Match the refresh schedule to the decision cycle and source availability. Daily plant reviews may need more frequent updates than monthly portfolio meetings. Faster refresh adds little value when owners update project records only once a week.
Who Should Own Dashboard Definitions?
Assign ownership at the measure level. The PMO may own project health and reporting completeness, while finance controls actual cost definitions and plant leaders approve local operational mappings.
Can Finance and Project Data Appear in One Report?
Yes, when the organization defines the source of record, mapping logic, update timing, and reconciliation process. The dashboard should also make data latency visible so readers do not compare figures from different reporting periods.
Build the Dashboard Around Manufacturing Decisions
Power BI gives manufacturers consistent visibility across project work when sites use a governed data model and common reporting process. The strongest dashboard gives each audience the information required for its next decision while preserving shared definitions across the portfolio.
Review manufacturing project management in Microsoft 365 to see how BrightWork 365 supports plant, PMO, and executive reporting.