
Deploying a solution to standardize your project management processes can be quite a challenge.
One of the most important considerations is that any solution helps team members more than it impedes them, and is used a way that fits the way they work. The best solution is one that will help and guide the project team through the project management process.
This article will cover three key ways you can leverage templates for project management in Microsoft 365 to deliver more effective project management in your organization:
-
First, we’ll be getting into how to adjust personal options in the BrightWork 365 app, like personal views and personal charts – so your team can access project information in a way that works for them.
-
Second, leveraging business process flows and forms for project management, and how you can use them to bake your processes right into BrightWork 365.
-
Finally, we’ll talk about ontent templates, which is a way for you to give your projects a head start with information pre-populated as you start a new project.
Overview of BrightWork 365 for Project Management in Microsoft 365
One of the biggest benefits of leveraging Microsoft 365 for project management is that it centralizes all your project needs in one system – and is likely taking advantage of apps and tools you are already using in your organization.
Here’s a quick look at how BrightWork 365 leverages the Microsoft 365 platform to manage the full project lifecycle.
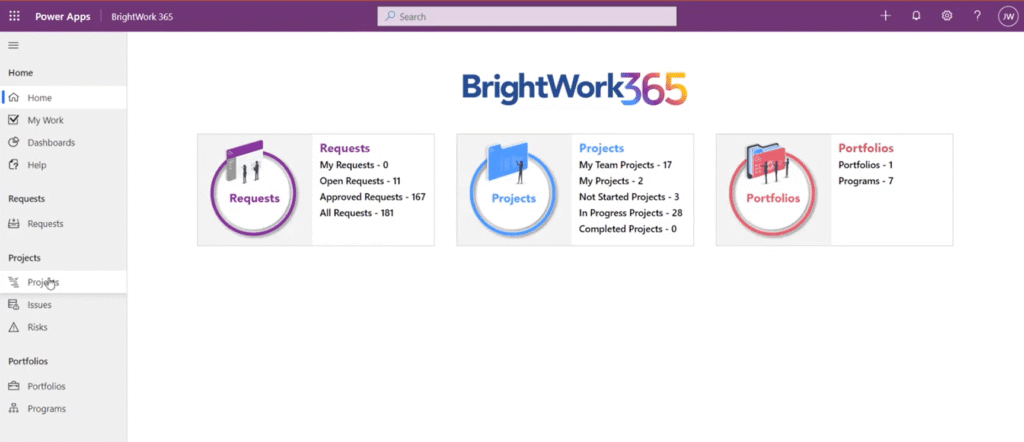
The first screen you will see when you log to BrightWork 365 is the homepage. On the homepage you will see high-level key performance indicators presented for easy viewing.
From left to right you will see:
-
Requests that are either in in play, in various stages, how many are open, how many are approved, and which ones you’ve submitted or related to you.
-
Projects that are in our project section, their status, and any projects you are a part of.
-
Portfolios and how many programs there are within the portfolios.
Process Project Requests
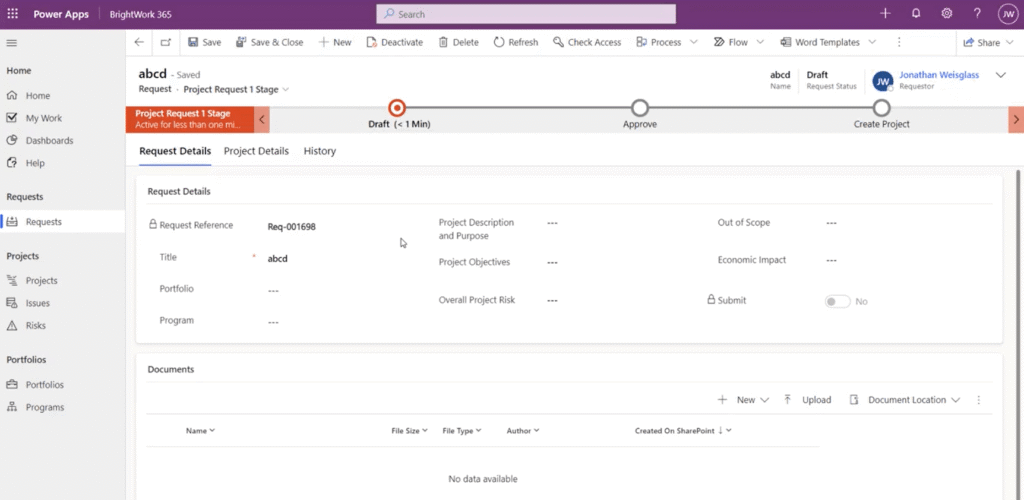
It’s really create a new project request and submit that for approval. Once you name your project request and select the template you’d like to use, there will be a form to fill out with additional information about the project request. You’ll also see the business process flow that the request will follow.
The Requests module is driven by Power Automate.
Manage Projects
The request would be accepted, approved, a project would be created, and you move on to the project management aspect of BrightWork 365.
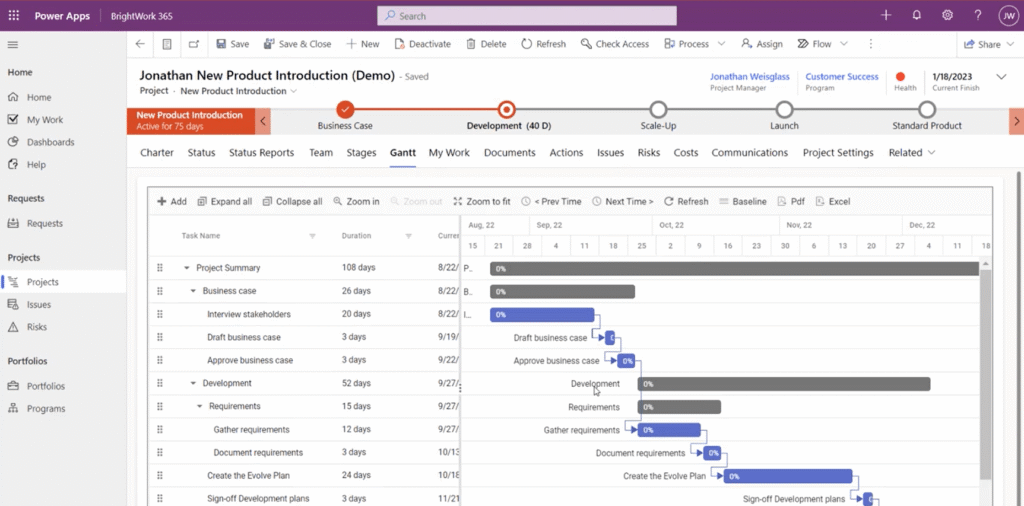
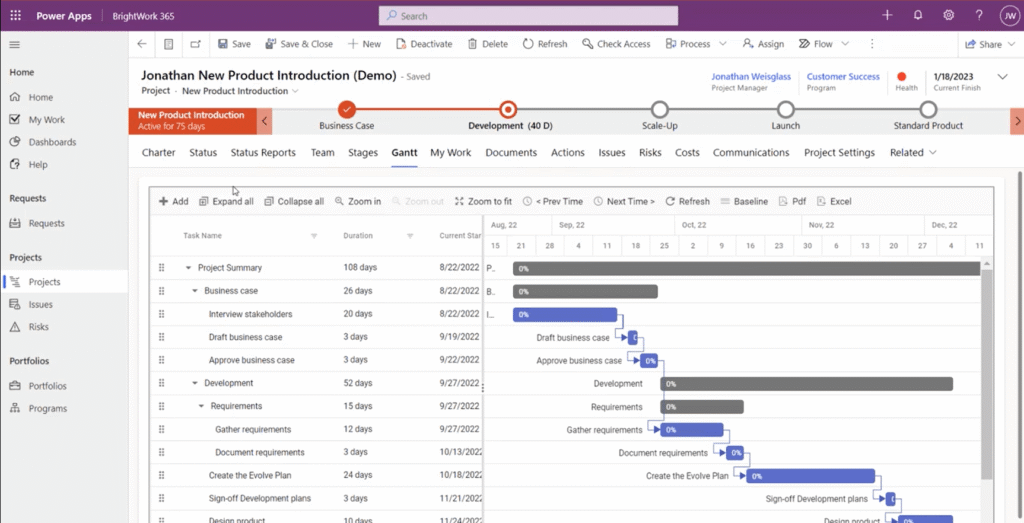
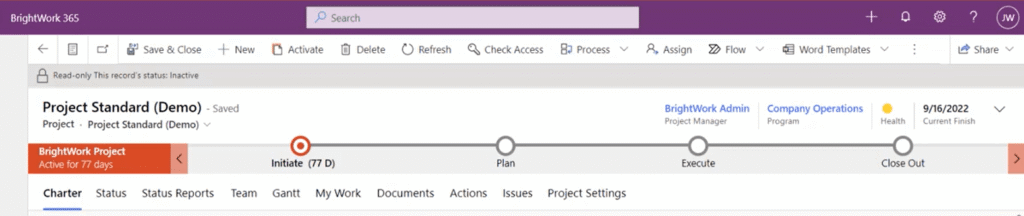
Here is an example of a New Product Introduction template in BrightWork 365, and you’ll see the framework of a typical project:
-
Project Charter
-
Status information
-
Who is on the team
-
Gantt view, which will show you all of the tasks along with their parents listed above.
-
My Work reports.
-
A SharePoint online document library.
-
We have a way to keep track of various actions
-
Issues list (What’s the project without issues?)
-
Risk management.
-
Cost and budget information.
-
The ability to capture and create various types of communication.
-
And Project Settings for an admin.
The Project Management is driven by Power Apps, and also leverages other apps like Teams and SharePoint Online.
Control Portfolios
And finally, we get to the portfolio level. BrightWork 365 allows you to have many portfolios if you wish or you could just have one, that’s up to you.
When you click into it, you’ll see that the portfolios have tracking information of their own similar to what you’ll see at the project level, but not exact.
All of the programs conveniently listed down below. These programs are part of this parent portfolio.
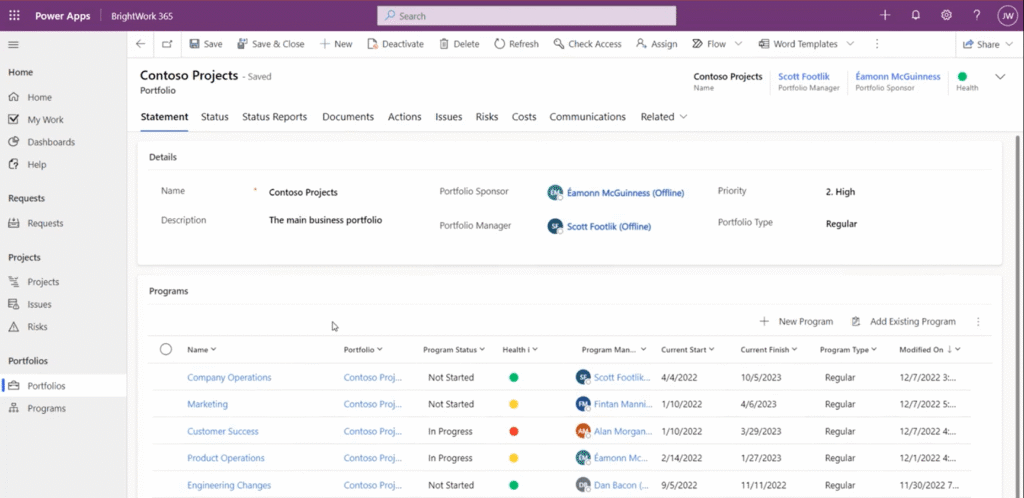
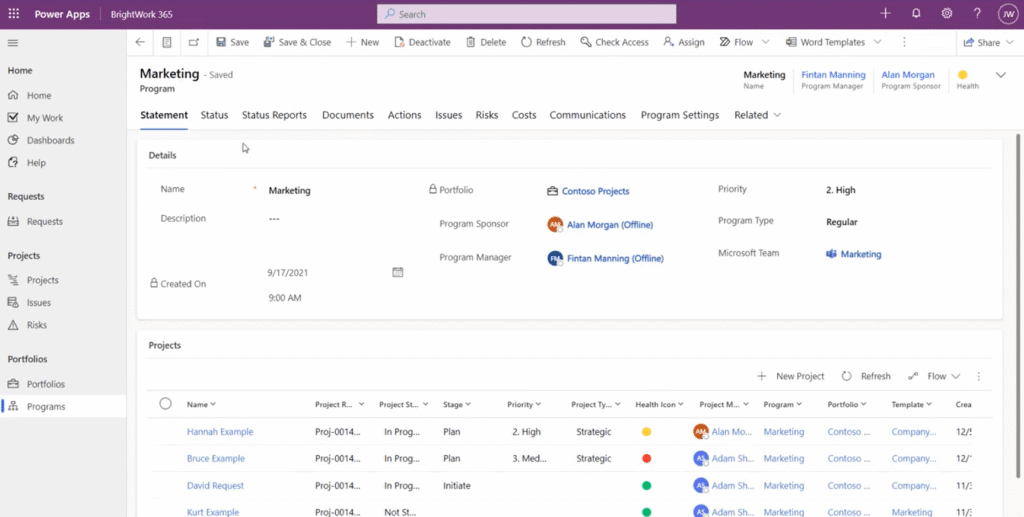
If you click into a program, each of these programs will have tracking information and child projects in turn.
Personalizing Views and Charts
Giving your entire project team the ability to create their own views and dashboards will go a long way to getting buy-in and keeping people using the solution.
In BrightWork 365, all users can create personal view and personal charts.
Personal Views
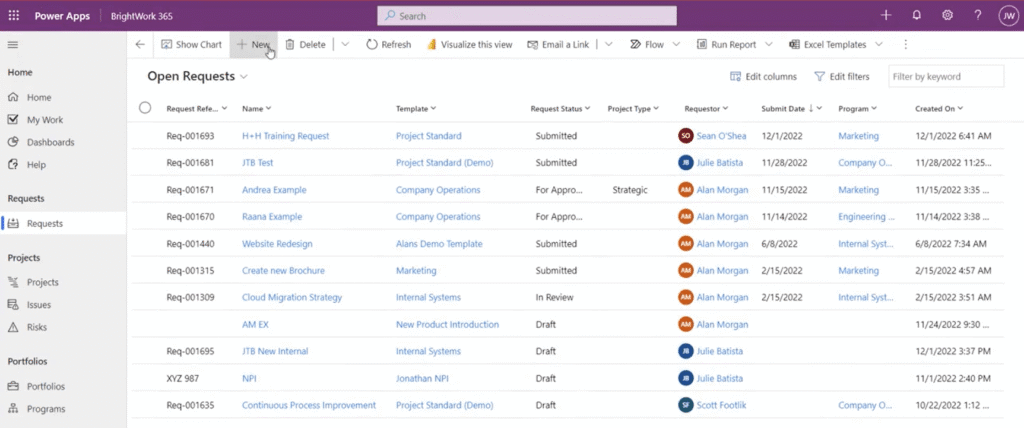
Here is a look at the Projects section in BrightWork 365, which is essentially a list view of a report. This is a default report list from the system (BrightWork 365 have different views that are included out-of-the-box).
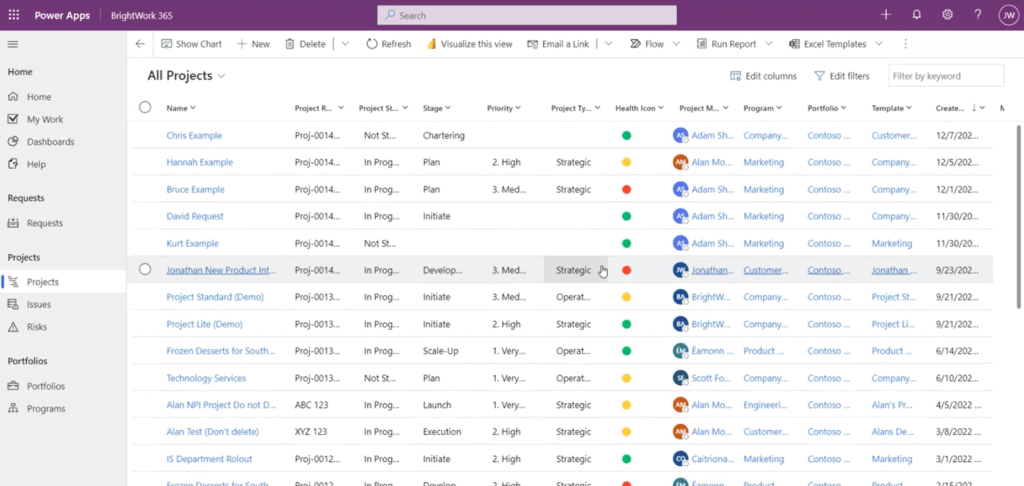
By clicking on the name of the report, you’ll see other views using different filtering options in order to view specific groups of projects.
You’ll notice some of the views have a little “person” symbol next to them.
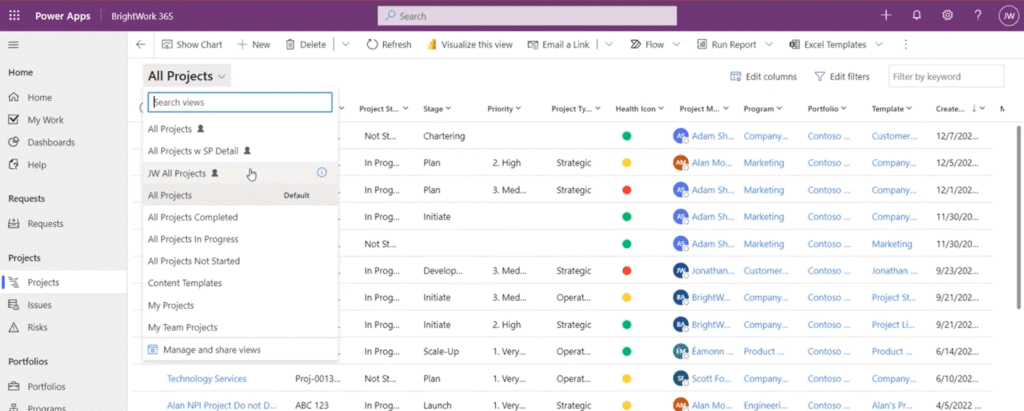
Those are either going to be views that you (the logged in user) created with different columns and a different configuration of the view, or it could be a view that has been shared by somebody else.
So how is that done?
You could start with any existing view and click on the Edit columns option. You will see a list of the existing columns that are showing left to right. Just click on Add columns to make a change.
Let’s say you want to bring in Percent Complete. Just select it and click on Apply.
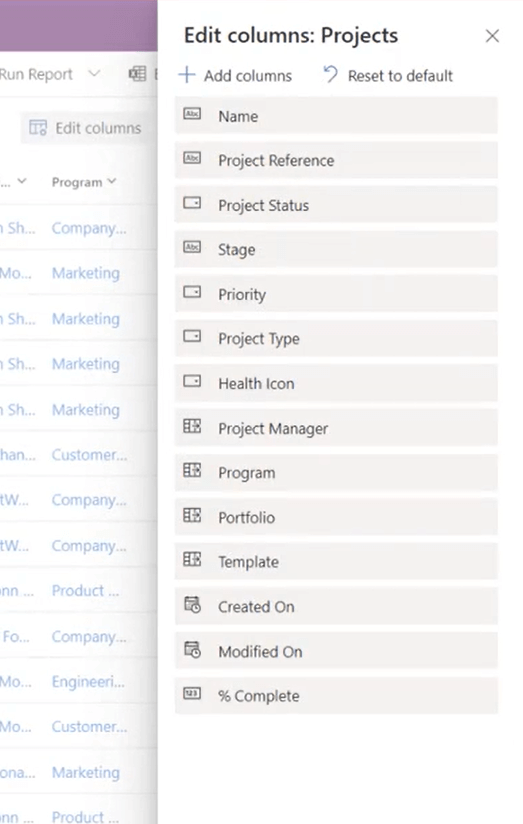
Now this view has been modified and the Percent Complete column is visible on the right side.
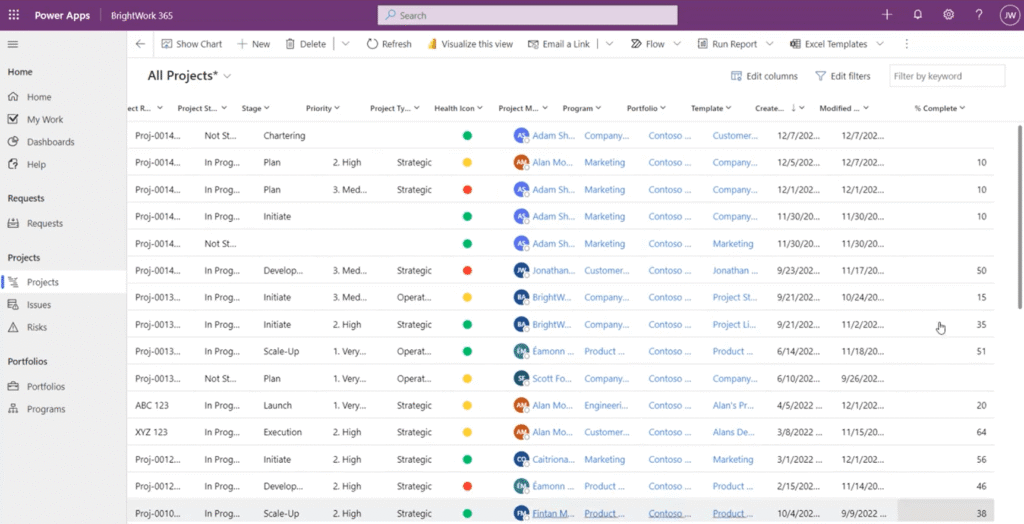
Note there is an asterisk beside the name of the view. That means that this is a modified view but it has not been saved just yet.
Sometimes you just need to filter the report as a once-off, but if you think you’ll be using this same view again, just open the down arrow there and click on Save as new view.
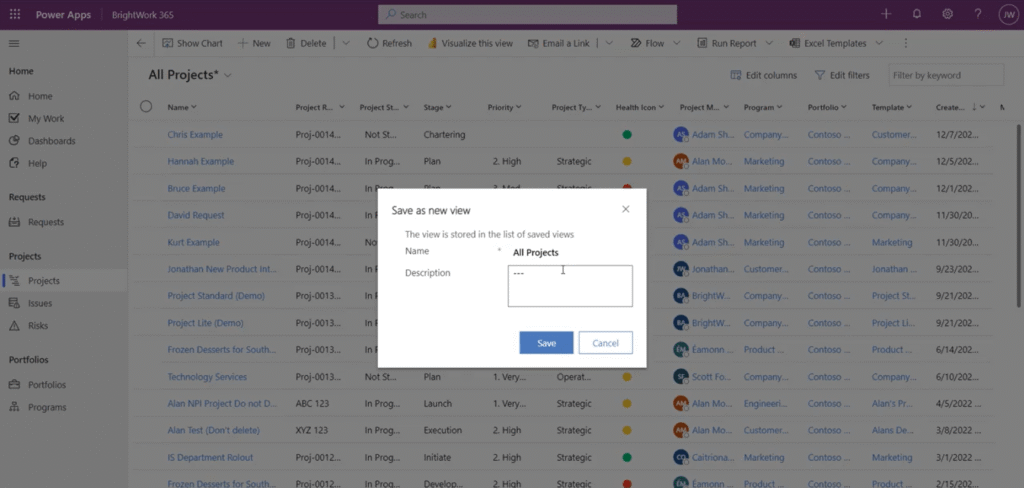
You can give it a name and save it and then that will in turn show up in the drop down, available to view anytime you log back in to this report again.
Note: Global views can be changed for everybody in the organization through system views. However, in order to change a system view you would need to have particular permissions and get into some deeper type of customization.
Personal Charts
Now if you want to do a similar thing for chart, you would just click on Show Chart in the top menu.
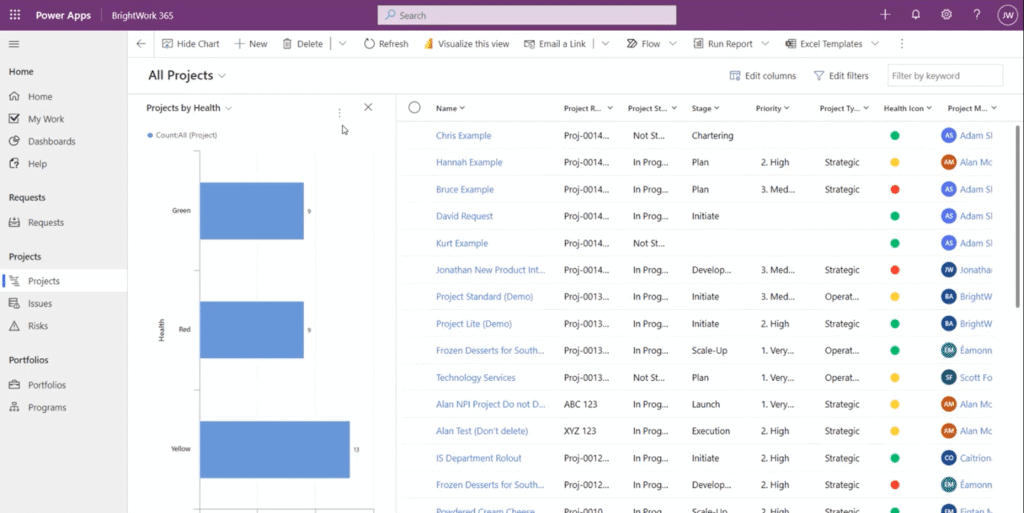
Again, out-of-the-box, there are plenty of included charts already. If you want to make a change to any of these, just choose the one that you’re interested in, then click on Edit, which will take you into a chart editor where you can get quite fancy with how you’re going to personalize that chart.
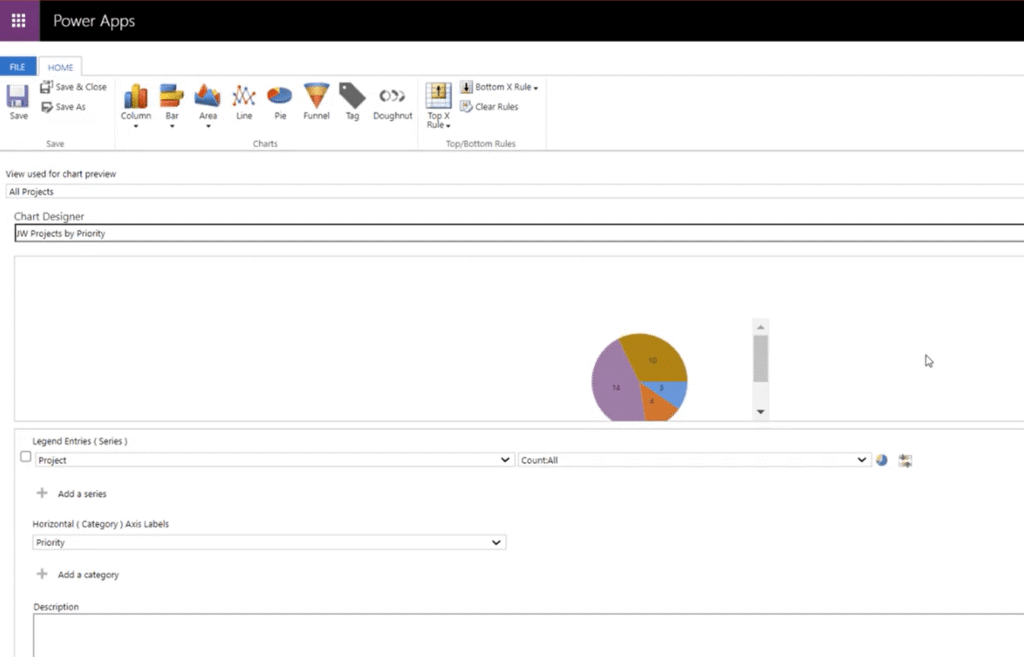
The chart is a pie chart as you see in the screenshot, but I can turn it into a bar chart if you wish. There is a lot of different formatting you can do for a personal chart. Just click Save and that appears the next time you refresh the page.
Note: Again, somebody with appropriate permissions and knowledge can create a system wide chart that anybody can avail themselves of.
Leveraging Business Process Flows and Forms for Project Management
Now let’s move into leveraging business process flows and forms for project management in Microsoft 365.
Microsoft 365 and the Power Platform has the capability to create business process flows to help guide people to get work done, as well as forms to provide the interface for users to interact with in the app.
BrightWork 365 leverages both business process flows and forms so that your organization can establish the standardized processes for project management in Microsoft 365
Business Process Flows
In order to explain this, we need to just back up a little bit and talk about templates. There are two main areas where we have templates available to start with:
-
Project requests.
-
Within the project sites themselves.
Requests
You can log new project requests in the Requests section. You of the first fields is to decide which project template you want the request to eventually use after it’s approved and the project is created.

The template that you choose will affect the different fields that need to be filled out in when you’re within the request stage, as well as the business process flow that the request will need to follow in order to go through its approval process.
The fields that will show up in the form and the approval process BPF are dependent on the template that you chose at the start of the request.
It could be a very simple approval process. Maybe the project is created immediately, or maybe it just goes through one person, or maybe it goes through several people. This will all be dictated by which template we chose at the beginning there and that, but that could be changed by somebody with the appropriate permissions.
Projects
This is also a business process flow, but in this case it’s not an approval process as we saw above. This is for the project itself and how it moves from one stage to the next.
This is also a business process flow, but in this case it’s not an approval process as we saw above. This is for the project itself and how it moves from one stage to the next.
Forms
So how do you select which business process flows to apply? That’s where the forms come in.
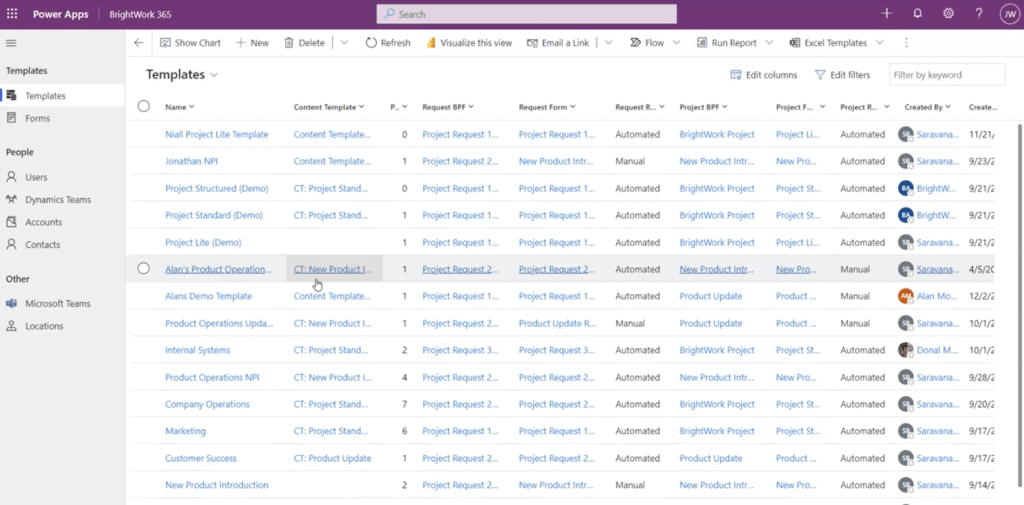
If you go into the Admin Area, you will see all of the templates that are available in your BrightWork 365 environment. Click into any of the templates to see what that project looks like behind the scenes.
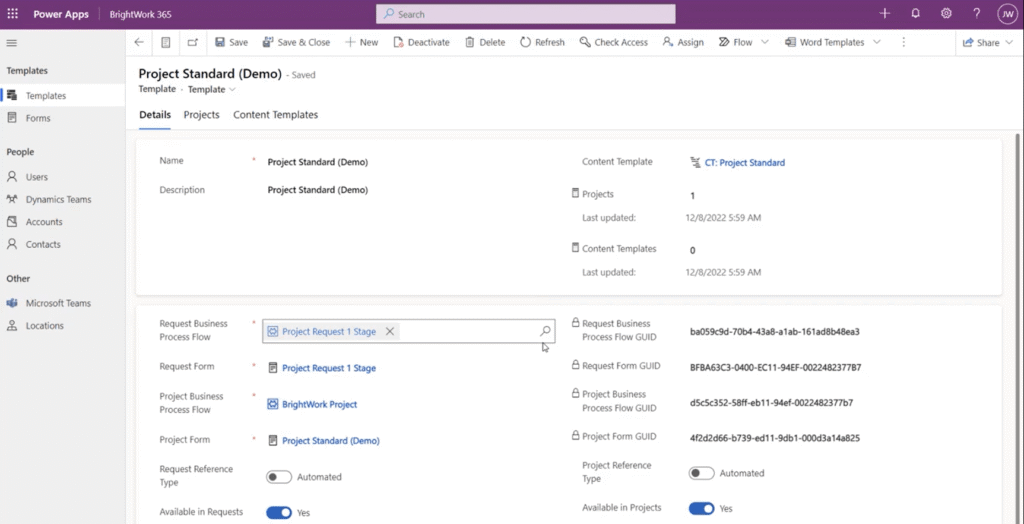
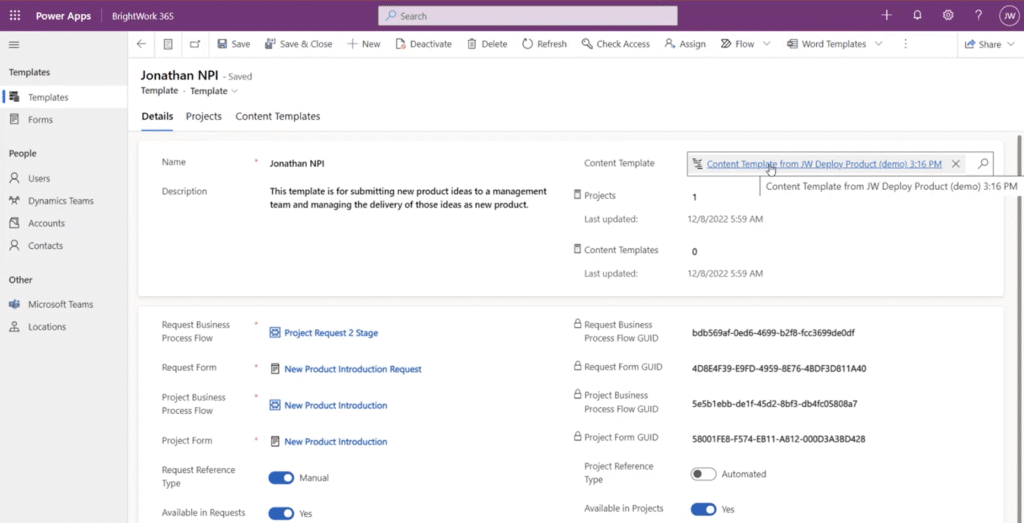
There’s a lot of information here, but we’re first going to focus on right now is specifying which request business process flow is used. So which approval process should be represented at the request stage when somebody says that they want to create a project using this template, and what the request form should look like.
So these would typically match if you have a one-stage approval process, it’s going to go to one person for approval. Then typically, the form would also be related to a one-stage type of a request.
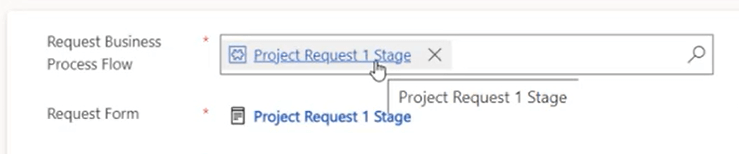
Changing the Request Form would change the information that is asked for in the project request. Changing the Request Business Process Flow would change the approval process that would be attached to that request.
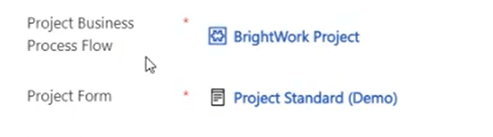
The Project Business Process Flow and the Project Form will drive the template once the project has been created. Changing the Project Business Process Flow would change what type of approval process is required to go from one project stage to the next. The Project Form would determine actual form that is used in the project site (e.g. the project processes exposed such as the Charter, Team, Gantt, etc.)
It’s very easy to change these selections just by changing the options in each field.
For example, you may want to modify the BPF at the request level. Maybe one-stage is a little too simple. You want to change it to a two-stage approval process where there a two different people who need to approve it. It is just as simple as clicking in the dropdown and selecting a new BPF.
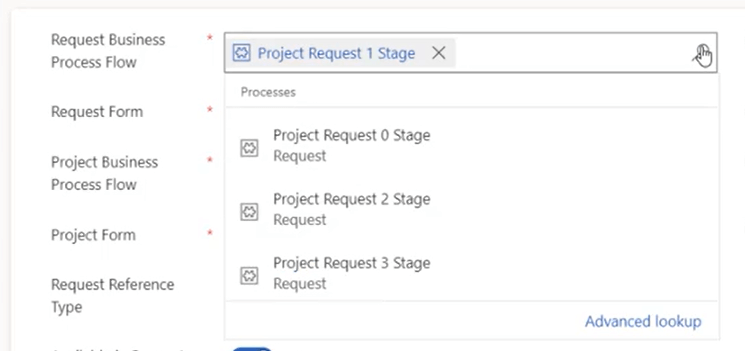
You’ll have various options out-of-the-box, but through customization, you can create additional forms, additional business process flows so that they’ll show up on this list as well.
Giving Your Projects a Head Start with Content Templates
Another way you can leverage project management templates in BrightWork 365 is by using Content Templates, which essentially gives your projects a head start with pre-populated information pulled in to a newly created project site.
Let’s say you have a project and you really like the way that it’s set up in terms of the Gantt, the work breakdown structure, the ordering of the tasks, the parent-child relationships in the tasks list. You think it would be great to use again in the future.

Maybe your project has various issues that came up or risks logged that you want to be available the next time somebody creates a project. (Risks is a great one because a lot of the risks that would have been present in the previous run of a similar project would very likely be present in the new project that’s similar to the one that had risks in the past). You want to make this easy for people to use that particular content again.
So all you need to do (and again if only if you have particular permissions) is go into the project settings of that project that you like so much, and choose to copy to a new content template.
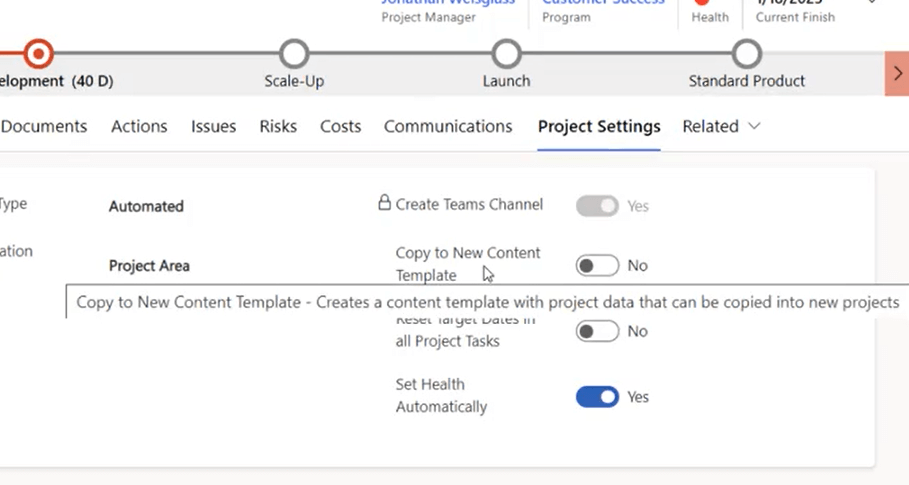
This would create what we call a Content Template, that just kind of sits in the background not doing anything but it is saved with all of the data that is in your project site.
The next step is to actually make use of that Content Template. In the Admin Area, you’ll find the list of template that people would choose when going to create a new request or going to create a new project.
One thing that you can do is make a copy of one of these existing templates. Then you can associate that template that somebody would choose with the content template that you just created. And that creates the link up there.
When somebody goes to create a new project and selects the content template, they will not only get the project management framework of the template. It will also bring along all of the content that’s in that content template that you created.
In Summary
The best way to roll out standardized project management processes and drive adoption is to build your project management processes right into your chosen collaborative platform.
In this blog, we covered how BrightWork 365 leverages Microsoft 365 and the Power Platform so you can improve project management success by:
-
Give your team the option to create personal view and charts – so that they can view information in the way they want in order to be more effective.
-
Use business process flows and forms to instill your own project management processes into the project management lifecycle in BrightWork 365
-
Use content templates to give project managers a head start, with templates already populated with key information like project plans, issues, risks, or documents.