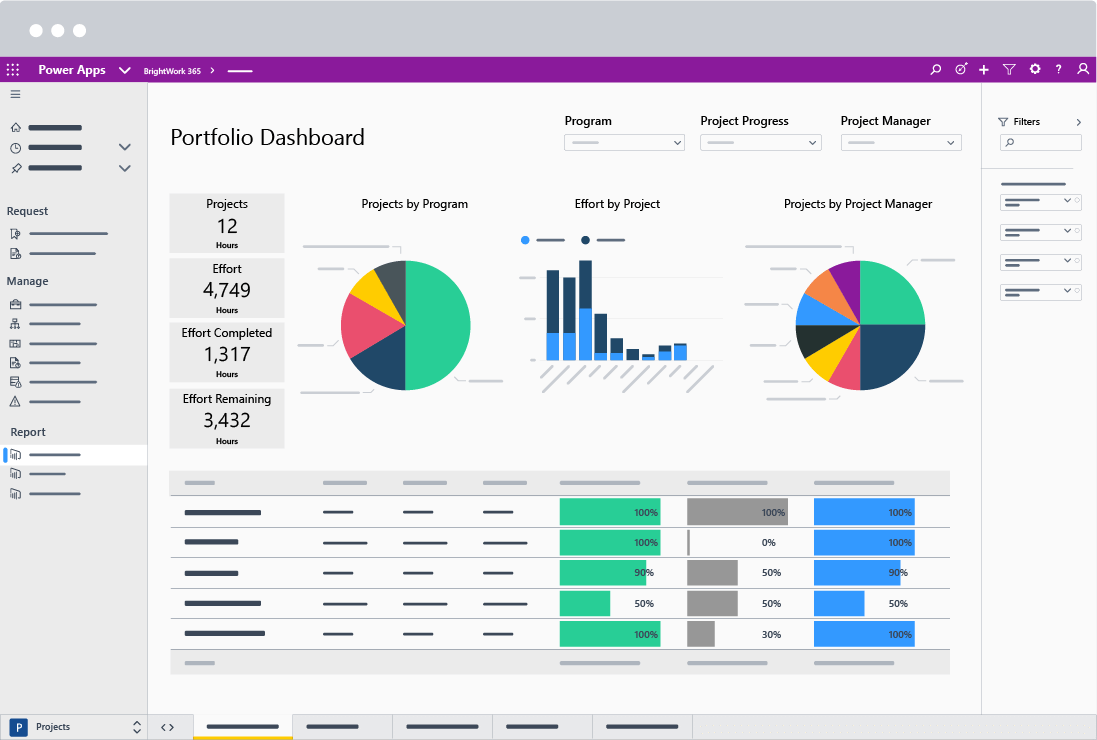
Project teams are generating more data than ever. Trying to track tasks, budgets, risks, and resources across multiple sources, like SharePoint Online or Excel, is a time-consuming task for any project portfolio.
Book your custom demo of BrightWork 365
That’s where a business intelligence platform like Microsoft Power BI can help. Power BI, a tool for gathering and analyzing data, helps organizations to find, surface, and act on business insights, often presented via a Microsoft dashboard.
Centralize Project Reporting with BrightWork 365 and Power BI
BrightWork 365, a new project and portfolio solution for Microsoft 365, leverages Microsoft Power BI for portfolio, program, and project reporting.
In this article, you’ll see how to track work, performance, and resource allocation across multiple projects in one place.
What is Microsoft Power BI?
Power BI is a ‘”collection of software services, apps, and connectors that work together to turn your unrelated sources of data into coherent, visually immersive, and interactive insights.’’
Improve Project Oversight with Power BI
Power BI simplifies and enhances project reporting for senior executives, PMO leads, and project managers. Interactive reports provide detailed insights with real-time visibility into performance, tasks, and resource allocation.
With easy access to the right data, identifying projects that are delivering value or that need extra attention becomes straightforward.
A Unified Approach to Project Reporting
Microsoft Power BI is part of the Microsoft Power Platform, a low-code development platform that allows organizations to create custom solutions. The Microsoft Power Platform also includes Power BI, Power Apps, and Power Virtual Agents.
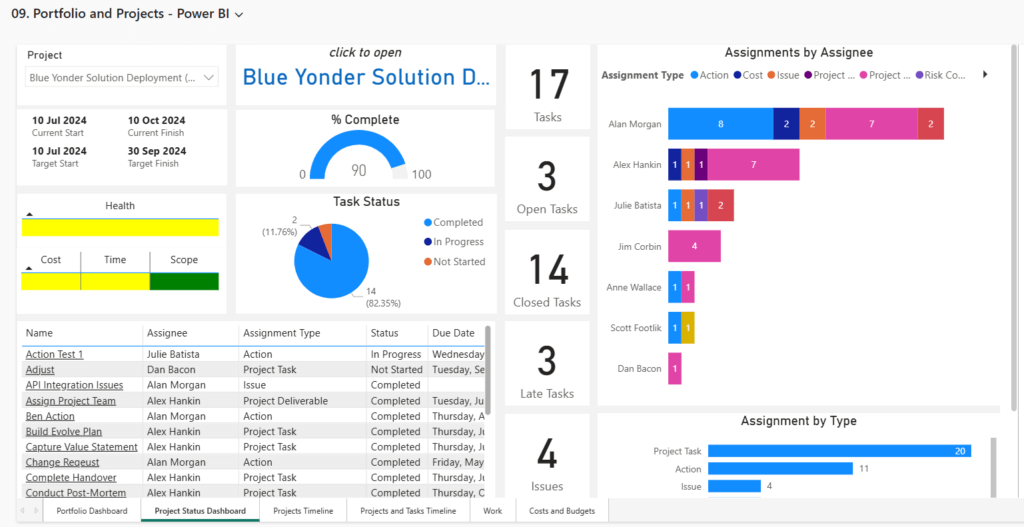
5 Power BI Reports for PPM Reporting in BrightWork 365
BrightWork 365 is a flexible project and portfolio management solution, deployed on the Microsoft Power Platform in your Microsoft 365 cloud environment.
To support data-driven decision-making, BrightWork 365 uses Microsoft Power BI for portfolio, program, and project reporting.
With interactive Power BI dashboards, teams can analyze tasks, resource allocation, schedules, and performance across multiple projects in real time. Each Power BI project portfolio dashboard is tailored to give users visibility across key metrics, with filters for portfolio, program, project manager, or task assignee.
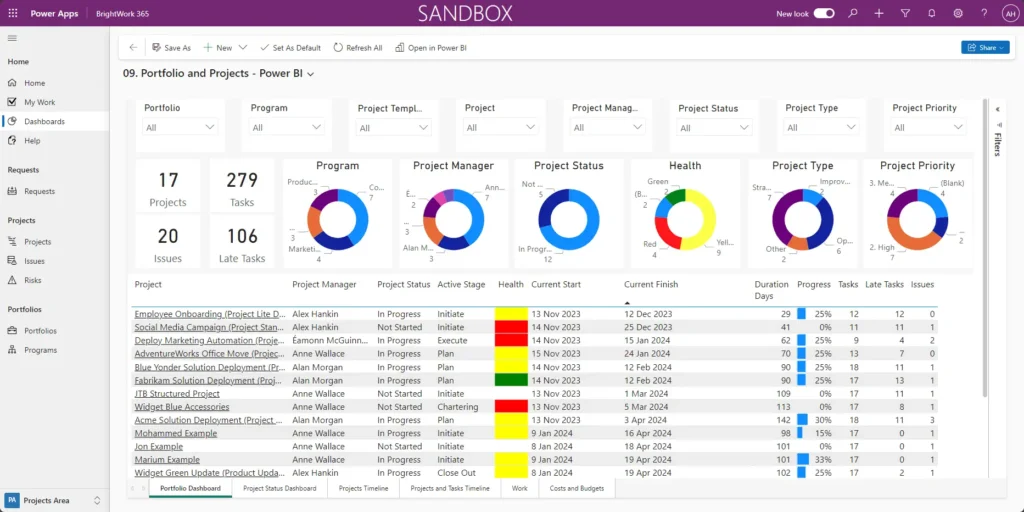
1. Portfolio Dashboard
The Portfolio Dashboard provides insight into the status, health, issues, and late tasks across all Power BI portfolio projects. It offers a high-level overview that supports faster, more informed decisions at the portfolio level.
2. Projects Timelines
Using an interactive Gantt chart, senior executives and PMO leads can track the schedules for all projects in one place.
Check the current start and finish date and the status (underway, late, or overdue) of projects.
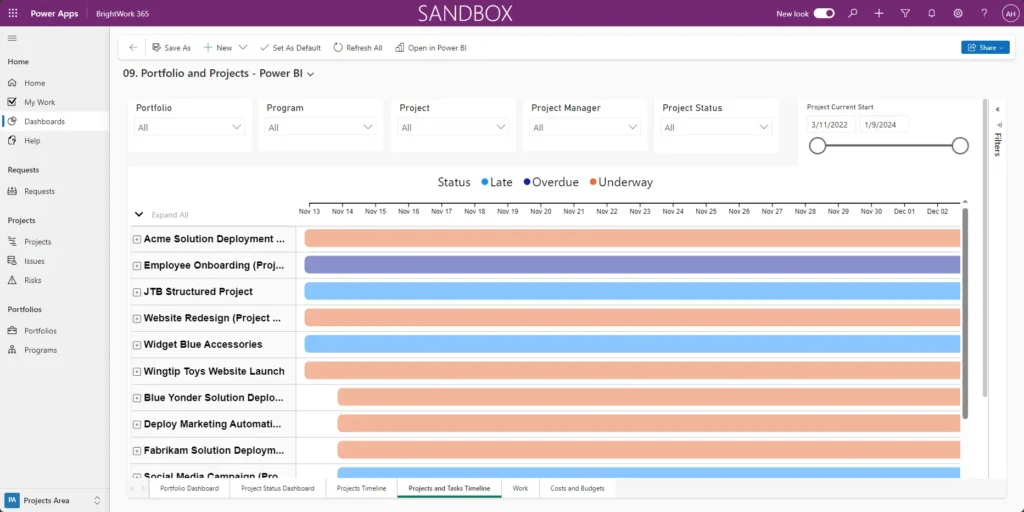
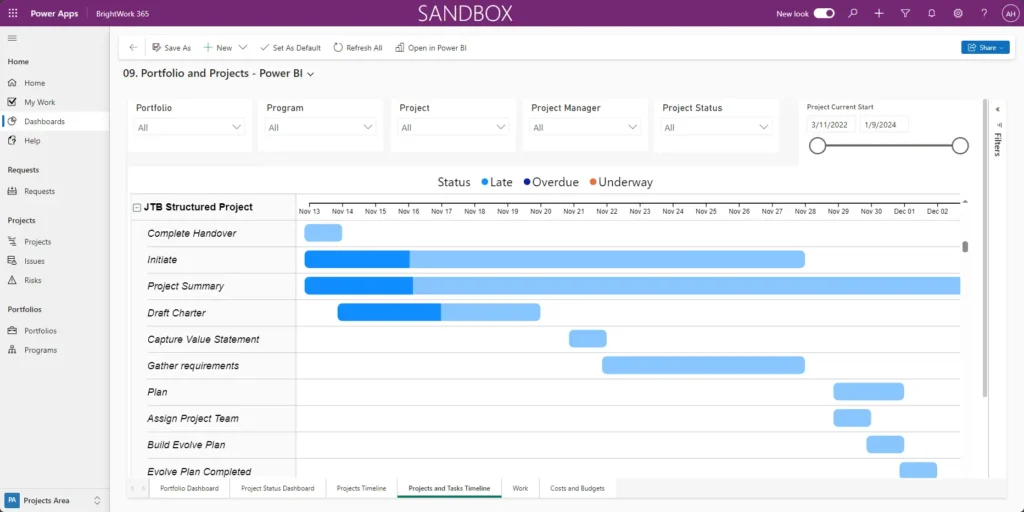
3. Projects and Tasks Timeline
Need more information on tasks? See the current start and finish date and the status (underway, late, or overdue) of tasks per project using an interactive Gantt chart.
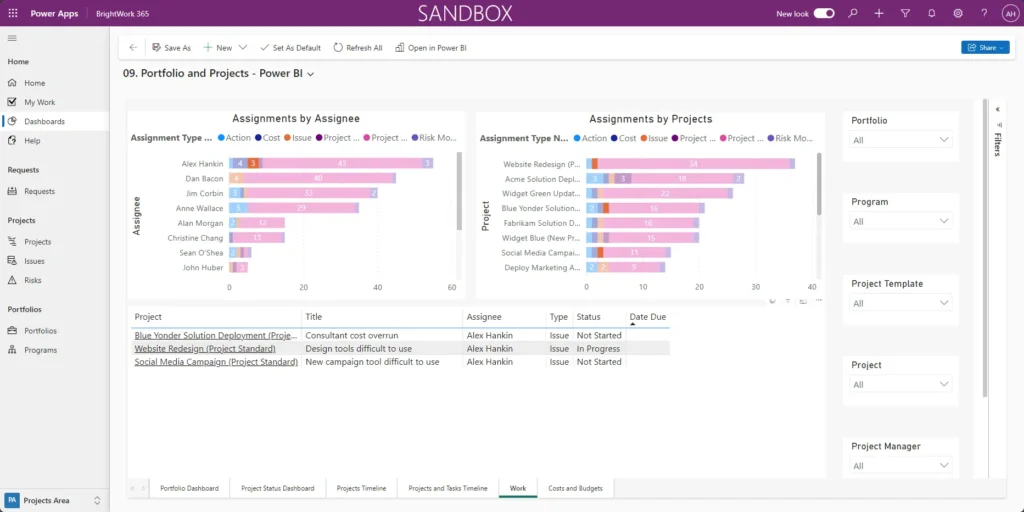
4. All Work
All Work surfaces tasks, deliverables, issues, and risks due across all projects in one place.
This view helps the team to understand and balance work assignments fairly.
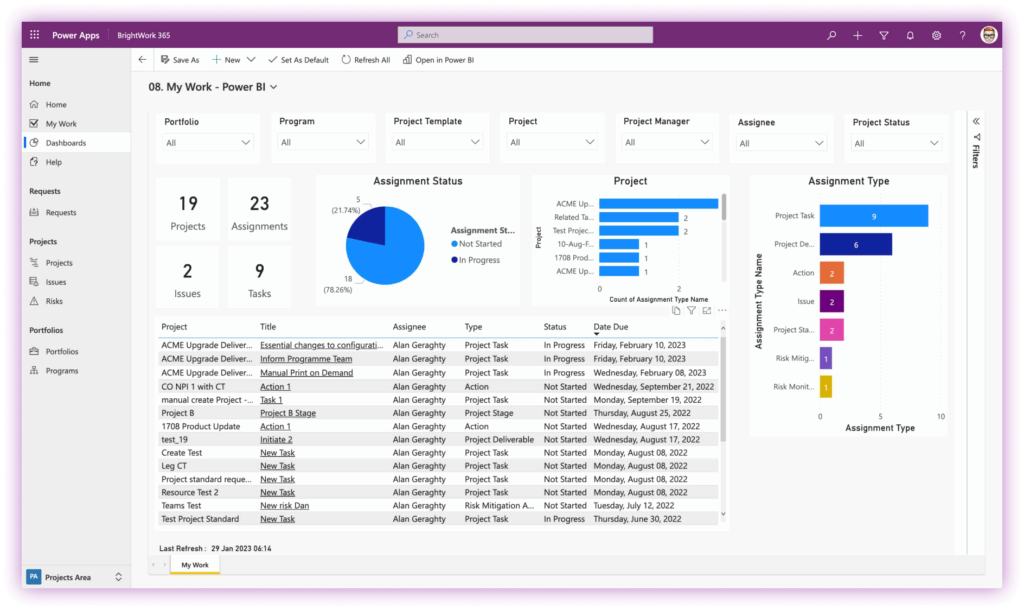
5. My Work
Similarly, ‘My Work’ displays (tasks, deliverables, issues, and risks assigned to the logged-in user across all projects in one place.
Try Power BI in BrightWork 365
BrightWork 365 combines the best elements of Microsoft 365, such as Microsoft Teams, Microsoft Power BI, and Microsoft Power Automate, with our proven project management processes.
This means teams can work with their preferred Microsoft 365 apps whilst giving senior executives instant visibility and access to project data. Book your custom demo of BrightWork 365 or contact us for more information.
