

Key Takeaways
What you’ll learn:
-
How AI can enhance project reports with predictive analysis and actionable insights
-
A 7-step checklist for making sure that your project reports are easily accessible and consumable by stakeholder
-
The importance of using project management software for streamlining project reporting, especially in the age of remote working
-
Why you should use the Microsoft 365 platform for project reporting and some out of the box examples from BrightWork 365
In an age where remote work is becoming the new every day and data-driven decision-making is more crucial than ever, project reporting has become more than a managerial obligation. It’s an art and a science that combines traditional project tracking with modern metrics and advanced data visualization.
This guide will walk you through seven essential steps to craft a project report that informs and engages your stakeholders. We’ll explore the role of AI in project management, delve into the importance of remote work metrics, and discuss cutting-edge data visualization tools that can make your reports more insightful.
Whether you’re a seasoned project manager or just getting started with project management basics, these steps will help you write a project report that adds value to your organization’s knowledge base for future projects.
Why are Project Management Tools Vital for Report Writing?
The importance of robust project management tools for effective report writing cannot be overstated. Here’s why:
-
Centralization: Project management tools are a central hub for all your project data, streamlining project management and reporting processes.
-
Efficient Tracking: These tools make it easier to monitor work progress during the monitoring phase of project management, helping you stay on top of tasks and milestones.
-
Risk Identification: Advanced features enable you to spot potential risks early, allowing for proactive management.
-
Stakeholder Communication: Keep all stakeholders in the loop with real-time updates and comprehensive reports.
-
Data Visualization: Utilize features like Power BI to transform raw data into insightful visuals, aiding in better decision-making.
-
Custom Reports: Depending on organizational needs, create specialized reports that offer in-depth analysis and recommendations upon project completion.
The Evolution of AI in Project Management Tools for Report Writing
When crafting an impactful project report, your tools can be a game-changer. And let’s talk about the elephant in the room: Artificial Intelligence. AI is no longer just a buzzword – it’s a reality transforming project management and reporting.
According to a systematic literature review published in MDPI, AI’s role in project management is increasingly significant, offering advanced capabilities like predictive analytics and risk assessment.
The Power of Predictive Analytics
These advanced AI tools centralize your project data and offer predictive analytics, risk assessment, and automated insights that can be invaluable for your report. Like Power BI revolutionized data visualization, AI algorithms can sift through massive amounts of data to highlight trends, predict risks, and recommend actions.
Making AI Accessible for Every Project Manager
Imagine reporting on what has happened and providing stakeholders with insights into what could happen. It’s like giving your project report a crystal ball. And don’t worry – embracing AI doesn’t mean you have to be a tech wizard. Many modern project management tools benefit from built-in AI features.
A thesis from DiVA portal explores the implementation of AI in project management and its impact on working personnel, indicating that AI is becoming more accessible and user-friendly.
The Future of Data-Driven Decision Making
AI’s capabilities equip stakeholders with data-driven insights for strategic decisions. It’s not just about tracking work and identifying risks anymore – it’s about forecasting them and offering actionable solutions. Welcome to the future of project reporting.
Types of Project Reports and Their Formats
Understanding the types of project reports you need to create is crucial. Whether it’s a project summary report, a project health report, or a project completion report, each serves a unique purpose and audience.
Knowing the format, whether a pie chart, bar chart, or complete chart, can also help present the data effectively. Writing a report is a valuable opportunity to evaluate the project, document lessons learned, and add to your organization’s knowledge base for future projects.
Data Visualization: Modern Tools and Techniques
Data visualization has come a long way from simple pie charts and bar graphs. With the advent of AI, we now have tools that can display and interpret data. Think of AI-powered heat maps that can show project bottlenecks or predictive line graphs that forecast project completion based on current trends.
Techniques for Effective Data Presentation
Modern data visualization techniques like interactive dashboards, real-time data streams, and even augmented reality (AR) representations are making it easier than ever to understand complex project metrics. These aren’t just for show; they offer actionable insights that can significantly impact project outcomes.
Making Data Visualization Accessible
The best part? These advanced visualization tools are becoming increasingly user-friendly. You don’t need to be a data scientist to use them. Most project management software now integrates seamlessly with these tools, making it easier than ever to incorporate advanced data visualization into your regular reporting.
The New Normal of Remote Work
In today’s digital age, remote work is becoming the new normal. As project managers, adapting our reporting techniques to this changing landscape is crucial.
Critical Metrics for Remote Teams
When it comes to remote teams, some metrics become even more critical. Think along the lines of ‘Remote Engagement Rate,’ ‘Digital Communication Effectiveness,’ and ‘Virtual Team Collaboration.’ These KPIs offer a more nuanced understanding of how remote teams are performing.
Tools for Tracking Remote Work Metrics
Fortunately, modern project management tools have features specifically designed to track these remote work metrics. From time-tracking software to virtual “water cooler” moments captured for team morale, these tools make remote work measurable in ways we couldn’t have imagined a few years ago.
Project Timeline and Milestones
A well-defined project timeline and key milestones are essential for any project. They not only help in keeping the project on track but also provide a basis for decision-making.
Project management software can automate this process, ensuring that reports are always up-to-date. Try the steps outlined below for writing better project reports.
How to Write a Project Report in 7 Steps
Writing an effective project report is crucial for evaluating the project’s health, keeping stakeholders informed, and setting the stage for future projects. Here are seven steps to guide you through the process.
Step 1. Decide the Objective
Take some time during the project management initiation phase to think about the purpose of the report. Do you need to describe, explain, recommend, or persuade? Having a clear goal from the outset ensures that you stay focused, making engaging your reader easier.
Understanding the objective is the cornerstone of effective project reporting. Whether crafting a project summary report or a detailed project performance report, aligning your content with the aim will make your report more coherent and actionable.
This is also the stage where you decide the key milestones and metrics to highlight in the report.
Step 2. Understand Your Audience
Understanding your audience is crucial for crafting a report that resonates. Whether you’re writing for stakeholders or team members, the language, data, and visuals should be tailored to their preferences and needs.
-
Language & Tone: Consider the communication style of your audience. Is a formal or informal tone more appropriate? Tailoring your language can build rapport and make your message more impactful.
-
Data & Graphics: Choose the types of data and visual aids that will most effectively convey your message to your specific audience.
-
Personal Preferences: Pay attention to how your audience typically communicates, whether in emails or other documents and try to mirror that style.
-
Report Format: Different stakeholders may require different levels of detail. A project manager may want an in-depth analysis, while a sponsor only needs an executive summary.
-
Audience Personas: Utilize audience personas to guide the tone, style, and content, ensuring your report caters to the diverse needs of all project stakeholders.
Step 3. Report Format and Type
Before you start, check the report format and type. Do you need to submit a written report or deliver a presentation? Do you need to craft a formal, informal, financial, annual, technical, fact-finding, or problem-solving report?
You should also confirm if any project management templates are available within the organization.
Checking these details can save time later on!
Different types of project reports serve other purposes. A project status report provides a snapshot of where the project is, while a project health report dives deeper into metrics.
Make sure to consider the medium – will this report be a PDF, a slideshow, or an interactive dashboard? The format can significantly impact how the information is received.
Step 4. Gather the Facts and Data
Including engaging facts and data will solidify your argument. Start with your collaborative project site and work out as needed. Remember to cite sources such as articles, case studies, and interviews.
To build a compelling case in your report, start mining your collaborative project site for crucial metrics like project milestones, resource utilization, and project health. Supplement this with additional data from external sources like articles and case studies.
Utilize data visualization tools like pie charts or bar graphs to make complex information easily digestible. Ensure the data is current to maintain the report’s credibility and remember to cite your sources for added reliability.
Step 5. Structure the Report
How you arrange your report is pivotal in how well your audience can digest the material. A logically organized report improves readability and amplifies its impact in delivering the core message.
Your report should have a natural progression, leading the reader from one point to the next until a decisive conclusion is reached. Generally, a report is segmented into four key components:
-
Opening Overview: This is the first thing your reader will see, and it’s usually crafted after the rest of the report is complete. Make this section compelling, as it often influences whether the reader will delve deeper into the report.
-
Introduction: This section sets the stage by offering background information and outlining the report’s cover. Make sure to specify the report’s scope and any methodologies employed.
-
Body: Here’s where your writing prowess comes into play. This is the meat of the report, filled with background, analyses, discussions, and actionable recommendations. Utilize data and visual aids to bolster your arguments.
-
Final Thoughts: This is where you tie all the report’s elements together in a neat bow. Clearly state the following steps and any actions the reader should consider.
Step 6. Readability
Spend some time making the report accessible and enjoyable to read. If working in Word, the Navigation pane is a great way to help your reader work through the document. Use formatting, visuals, and lists to break up long text sections.
Readability is not just about the text but also about the visual elements like pie charts, bar colors, and even the background color of the report. Use these elements to break the monotony and make the report more engaging. Also, consider adding a table of contents for longer reports to improve navigation.
Step 7. Edit
The first draft of the report is rarely perfect, so you will need to edit and revise the content. If possible, set the document aside for a few days before reviewing it or ask a colleague to review it.
Editing is not just about correcting grammatical errors – it’s also about ensuring that the report aligns with its initial objectives and is tailored to its audience. Use this stage to refine the report’s structure, clarify its key points, and eliminate any unnecessary jargon or technical terms to the reader’s understanding.
Automate and Streamline Project Reporting with Microsoft 365
Project reporting can often be a laborious and time-consuming task. Especially on a project where there are so many moving parts and different people involved, getting a clear picture of what’s going on can be pretty tricky.
That is why we recommend moving to a cloud-based solution for project management and reporting – and you might have guessed it: we recommend Microsoft 365! If you’re considering SharePoint, check out our build vs buy guide.
Why use Microsoft 365 for project reporting?
There are many benefits to using Microsoft 365 as the platform for your project management reporting, including:
-
Centralizing your project management and reporting on Microsoft 365 brings your project information into one place, so you can automate reporting and save time. If you’re still using excel for project management, here’s why you should consider switching.
-
You can access configurable and filterable reports based on the audience by leveraging the available reporting mechanisms in Power Apps, Power BI, and Excel. Everyone can see the information in the way they need.
-
Linked into the Microsoft 365 ecosystem, reports can appear in Power Apps, Power BI, exported to Excel, emailed in Outlook, or seen in MS Teams, so reports are available wherever the audience is working.
-
Having project data maintained in a single platform means that project reports are always up to date. No more chasing up PMs or team members for the latest document version!
5 Ways you can use BrightWork 365 for Project and Portfolio Reporting
BrightWork 365 is a project and portfolio management solution for Microsoft 365 and the Power Platform. Here are five ways you can leverage BrightWork 365 and Microsoft 365 for more efficient project reporting:
1. Capture Project Status Reports in a few minutes
BrightWork project sites have a “Status” tab where the project manager can capture what is happening. This is not a status report but a place for the PM to log the current status.
It is not a snapshot, as it will change regularly, but the info here will become part of the status report once the PM creates one. once the PM chooses to create one.
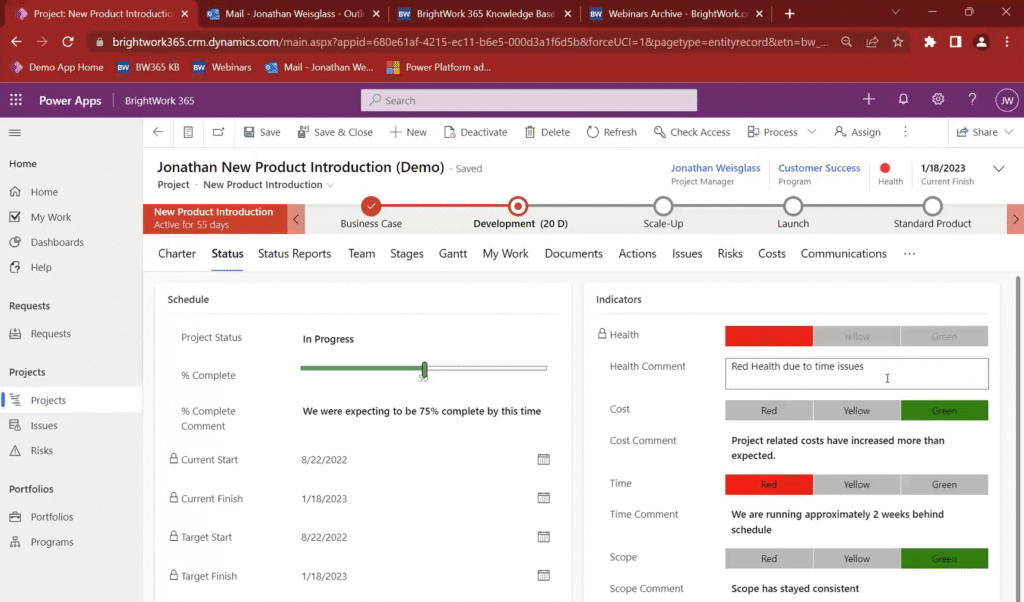
The Status Reports tab is where you can capture a snapshot of the project status at a point in time. It will bring in all the info from the “Status” tab, but you have the ability to add comments.
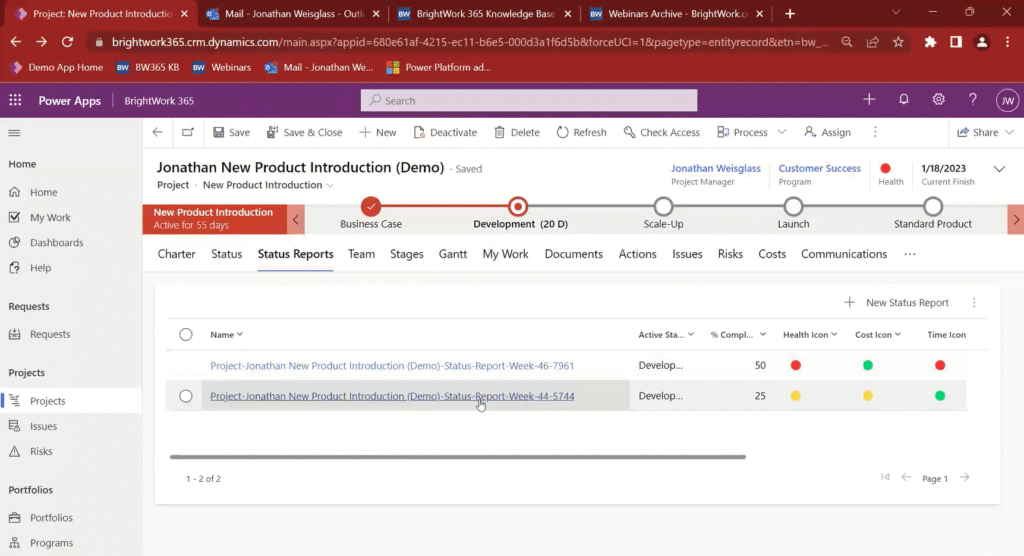
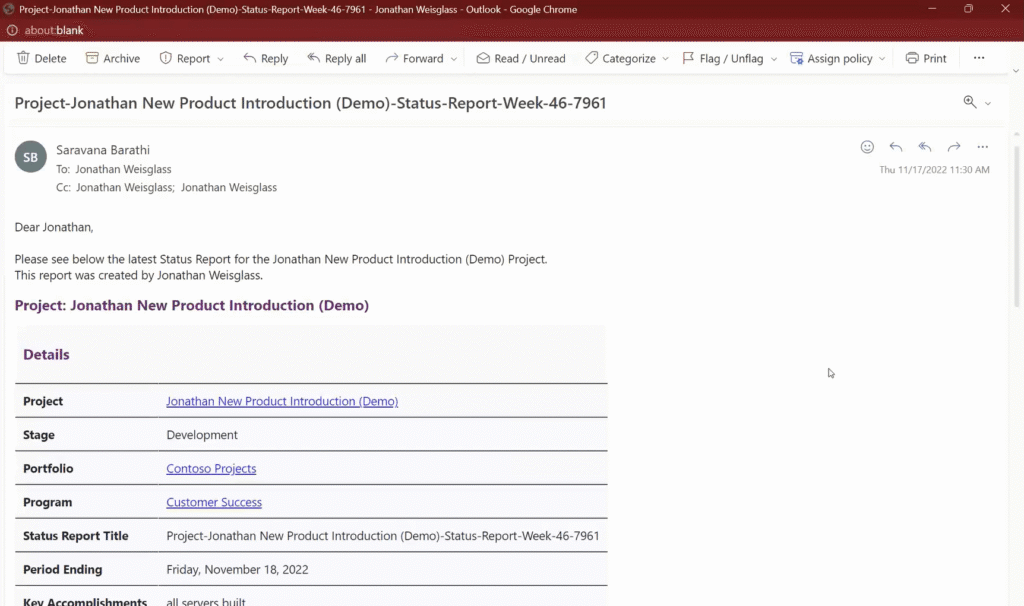
This will also create a new entry in the status report log, and create a Word document version of the report as well. This status report can also be emailed to stakeholders as needed.
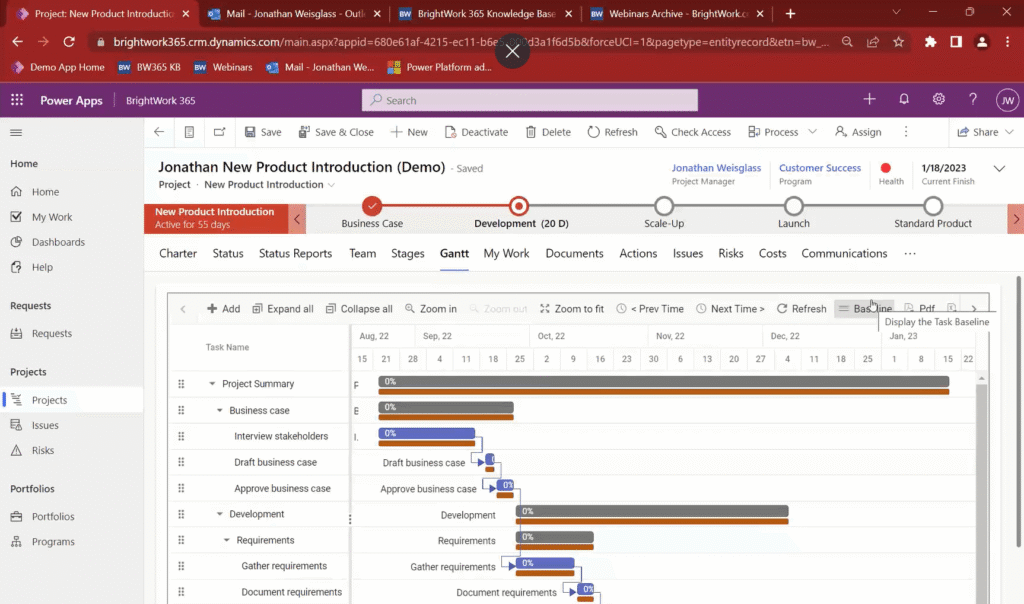
2. Track the project schedule with Gantt
At some point during project planning, you would have agreed on the project plan and Target finish dates or deadlines for the tasks. The plan timeline is laid out in the BrightWork 365 Gantt.
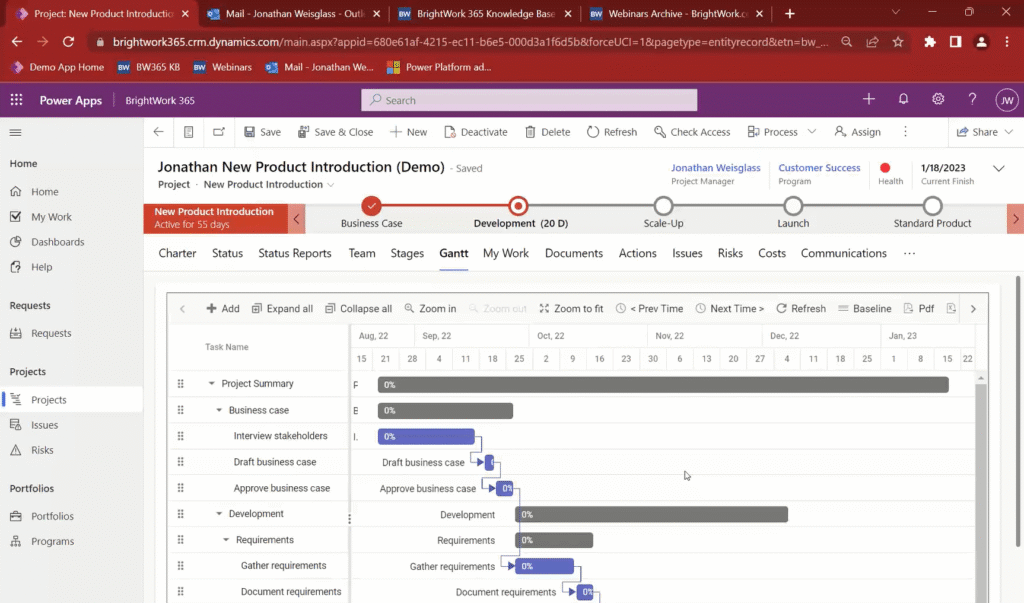
Nevertheless, as the project goes on, some dates and timelines may slip. And when those dates are updated it will affect the actual finish date of the project.
Project stakeholders can compare the Target (initial) dates of the plan to the initial plan by viewing the project plan against the original baseline.
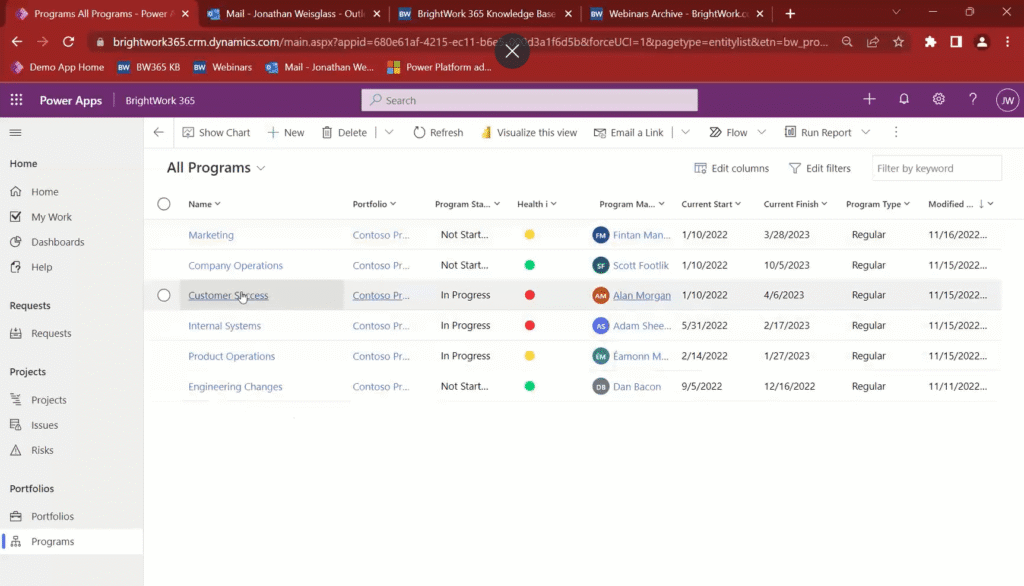
3. Get High-Level Visibility into Programs and Portfolios
BrightWork 365 enables a hierarchy for your project management – with Portfolios being the highest level. For example, a portfolio may house all the projects in a company.
Portfolios consist of many Programs, which are projects based on standard criteria (maybe business function or geography). The Portfolio and Program areas show a snapshot of the status of the underlying projects, including KPI indicators, status, dates, and type.
4. Surface Risks and Issues across all projects
One of the most critical elements for senior executives and project stakeholders is being aware of the project risks, especially understanding any issues that arise quickly.
I’ve heard it said before that “Senior executives don’t like bad news, but especially don’t like bad news late.” In BrightWork 365, team members or project managers can flag tasks or log issues on a project and escalate them to the program or portfolio level for complete visibility.
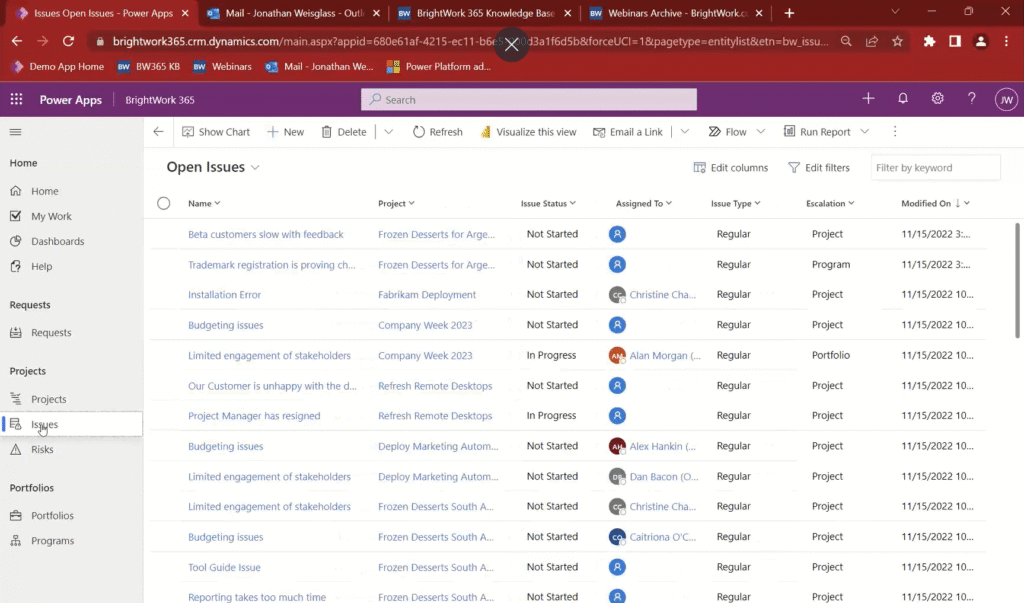
These reports are available directly from the navigation menu on the left hand side, so anyone can can view the current risks and issues without having to wait on a formal report, enabling quicker and better decisions.
5. Leverage Visual and Interactive Reports
The type and format of a report often depends on the audience. For example, senior executives often want the high-level details of a project. That’s where BrightWork 365 Power BI Dashboards come in.
BrightWork 365 pushes project data to visual and interactive Power BI dashboards. These reports give an overall summary of a program or portfolio, but can be filtered and sorted any number of ways as required. Again, the benefit here is that the dashboards are always real-time, and you never have to wait to understand.
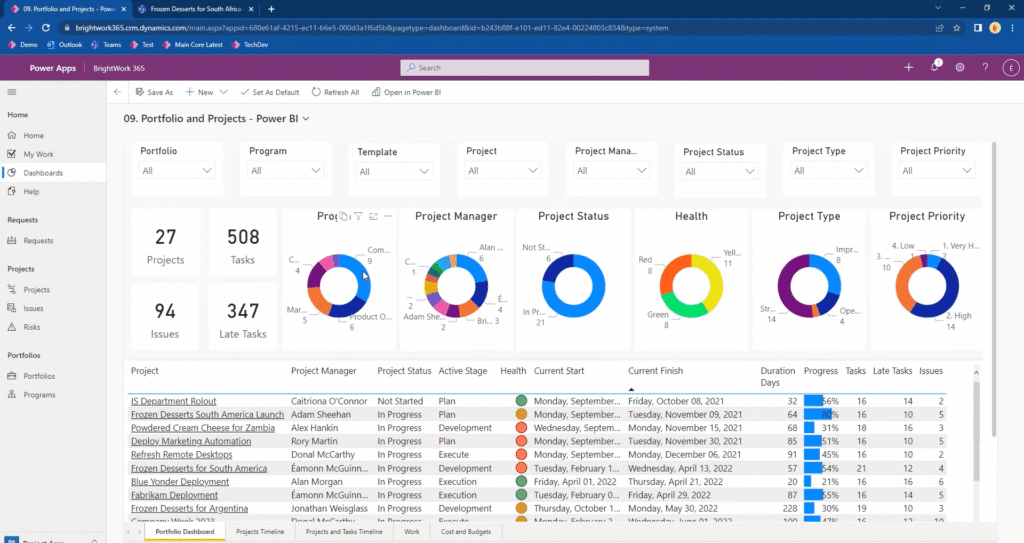
The reports also enable drill-down as necessary, in case you see an issue that requires further investigation.
Spend less time on your project reports with BrightWork 365
Streamline your project reporting process with BrightWork 365, a tool to centralize and automate your project data. Whether you prefer real-time dashboards or scheduled email reports, BrightWork 365 adapts to your needs, eliminating the tedious aspects of project reporting. Consider the following:
-
Centralization: BrightWork 365 consolidates all project information into a single platform, making it easier to manage and report.
-
Real-Time Reporting: As data is updated, reports are generated in real-time, ensuring you always have the most current information.
-
Flexible Access: Reports can be accessed through various methods, including logging in to view customizable dashboards or receiving scheduled email summaries.
Conclusion: The Future of Project Reporting
Project reporting has undergone a significant transformation, thanks partly to technological advancements like Microsoft 365 and BrightWork 365. As we’ve discussed, it’s not just about tracking tasks and milestones anymore.
Today’s project reports are data-rich, AI-enhanced documents that offer predictive analytics and actionable insights. They also cater to the unique challenges and KPIs relevant to remote teams.
As we look to the future, we can expect even more advancements in project reporting technology. However, the core principles of clear objectives, a deep understanding of your audience, and a well-structured format will remain constant.
By adhering to the steps outlined in this guide, you’ll be well-equipped to adapt to new tools and technologies, ensuring that your project reports remain valuable for decision-making and strategic planning.
Editor’s Note: This post was originally published in September 2016 and has been updated for freshness, accuracy, and comprehensiveness