
What you will learn:
This blog post will walk you through the elements and structure of a best-practice SharePoint Project Management Site and explain how to leverage free SharePoint template from BrightWork to manage a project.
A collection of flexible tools, SharePoint helps organizations build intranets, manage documents, and collaborate in a secure environment.
At its core, SharePoint is all about collaboration with document libraries, a newsfeed, wikis, and discussion boards. These features – and more! – make SharePoint an ideal tool for project management teams.
Using a SharePoint project site, it’s easy to centralize all project information and tasks in one place for the team to use together.
A SharePoint project site has a number of elements to help you manage a project effectively.
Let’s take a look at the structure of a typical SharePoint site – lists, web parts, sites, and site collections.
We’ll also see how these elements are part of the pre-planned project site in the Free SharePoint Project Management Template from BrightWork.
The screenshots below are based on the Free Template in an on-premises environment using the classic experience.
The Structure of a SharePoint Project Site
1. SharePoint Lists
A SharePoint site is populated by lists, which are used to organize information. Made up of headings, rows, and columns, a SharePoint list looks similar to an Excel spreadsheet. However, SharePoint lists are more flexible and are easier to control than a spreadsheet.
Likewise, lists are key to organizing project information such as tasks and issues. Using a SharePoint list, it’s easy to track and manage project data in one place. The lists are available to all team members, improving collaboration and removing data silos.
SharePoint lists are a useful way to manage project processes and information in a structured, transparent manner.
To reduce administration work and streamline tasks, you can also add workflows to lists, for example, collecting digital signatures to documents.
You’ll need the following lists – which ship with the Free Template – in your SharePoint project site:
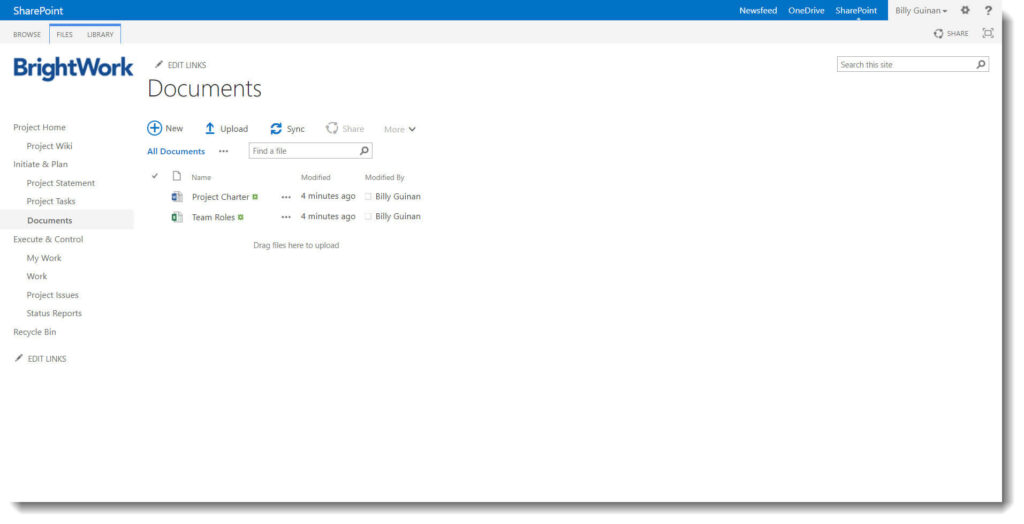
Document Library: Use to create a single repository for all project documents. Users can upload, download, delete, and rename the documents – depending on the permissions you have set for each team member.
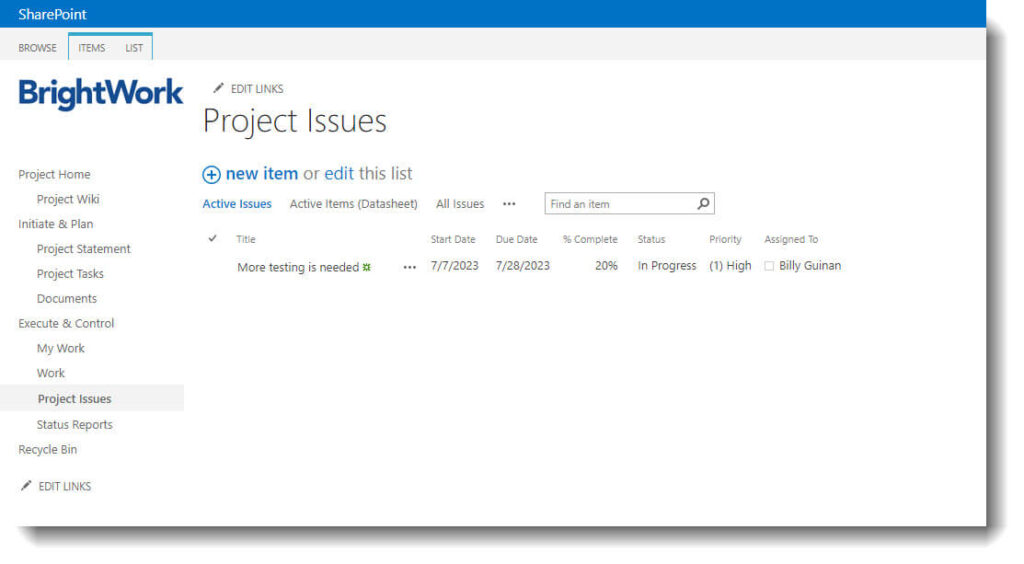
Issues: Use this list to track and manage issues raised by the team.
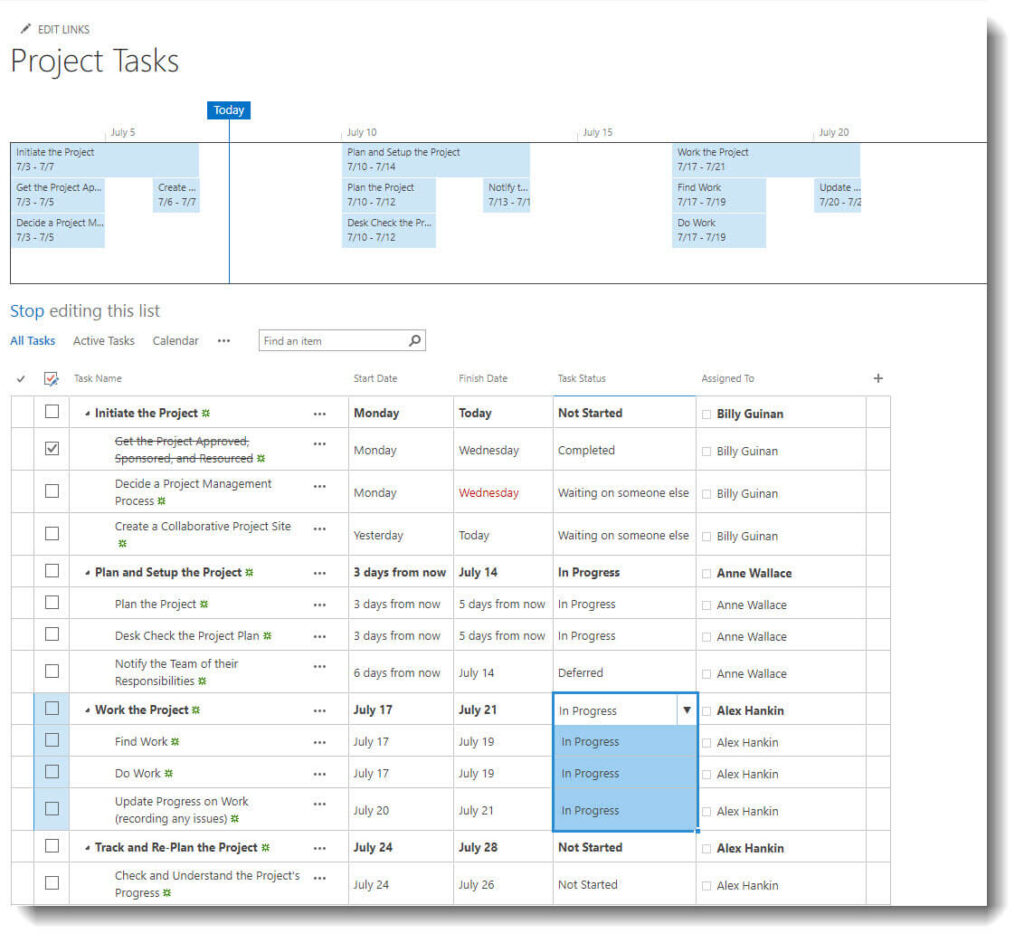
Tasks: Add tasks and subtasks to create the project timeline. You can also assign tasks to individual team members and track their progress.
You can also create custom lists in SharePoint so if your team is using Excel to track certain elements of project work, you can recreate the list on the site.
2. SharePoint Web Parts
A SharePoint web part is a type of list used to store content in your site.
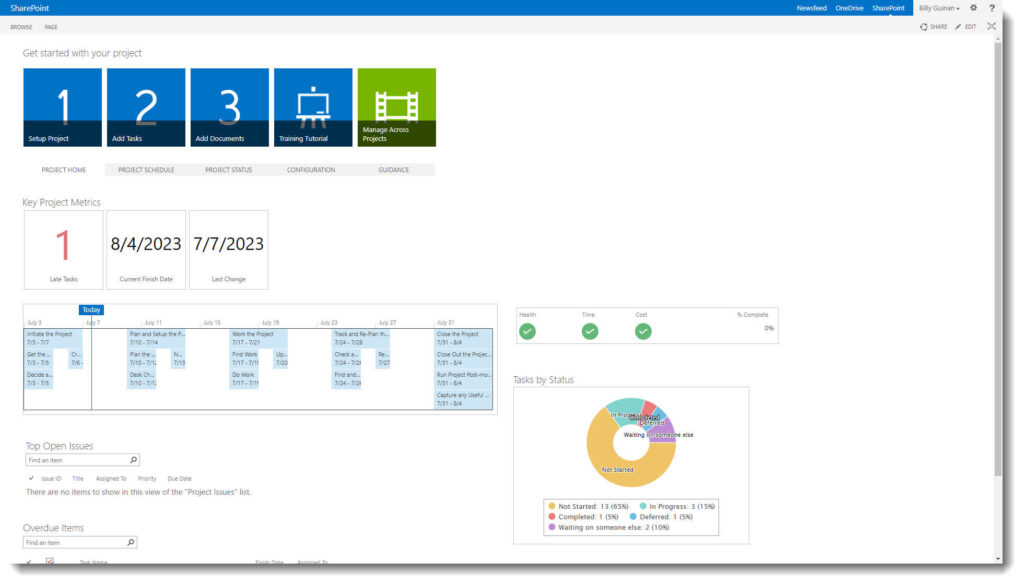
Web parts can function as a project dashboard or report, surfacing key project information in a usable way. For example, adding the ‘project tasks’ web part to the project homepages provides a snapshot of the underlying tasks list. Simply click on the information to get more details.
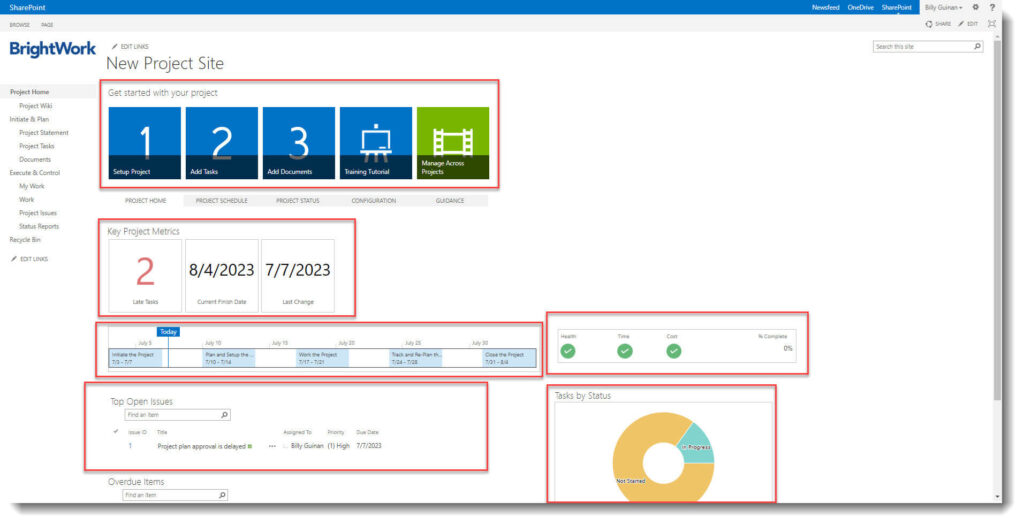
In the Free Template, high-level data on project metrics, tasks, project health, and issues are available on the project homepage using pre-configured web parts.
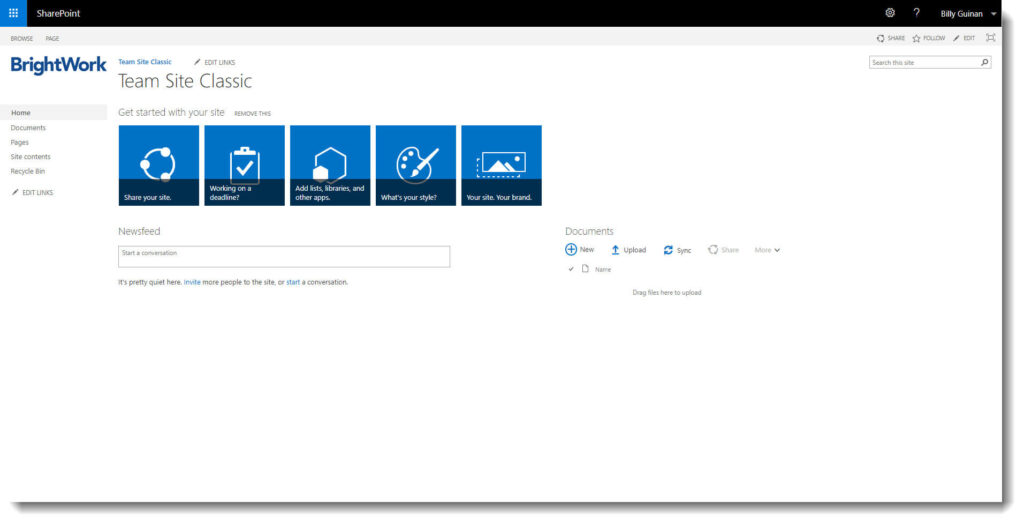
3. SharePoint Site

A SharePoint site is used to organize different types of content in one place. A SharePoint site is a home for your project, bringing together lists and web parts in one central location for your team.
Powerful search functionality is a key feature of SharePoint, especially SharePoint On-Premises. This is facilitated by adding all project information to one place. No need to waste any more time searching across numerous folders, tools, and network drives to find a document!
In addition to improving team collaboration, a SharePoint site will also make it easier for you to manage the project.
Having a centralized location to track tasks, find documents, and view reports means you don’t have to send regular ‘check-in’ emails to the team – just go to the site.
A site inherits key elements such as navigation, templates, and permissions from the umbrella site collection. However, you can configure each site can with its own content and security settings.
4. SharePoint Site Collections
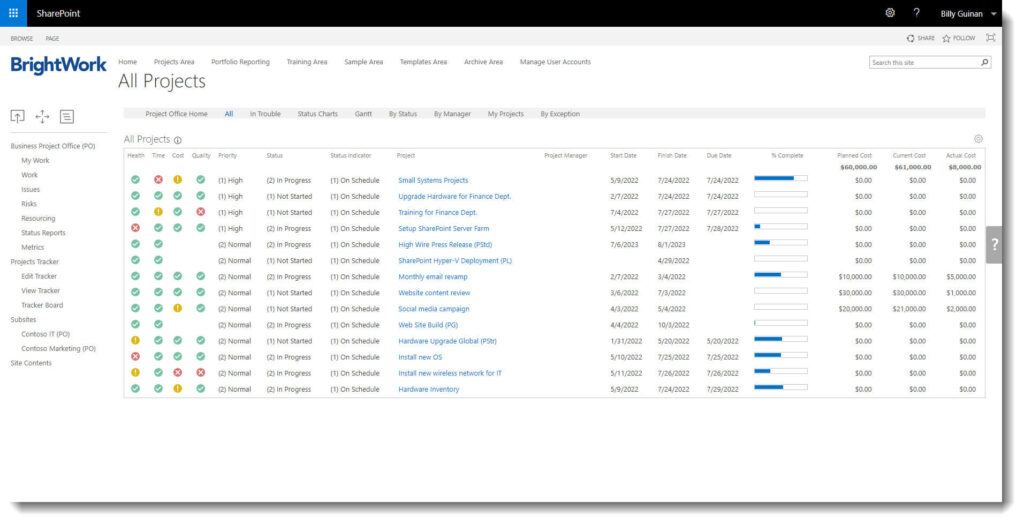
A SharePoint site collection is a collection of SharePoint sites. When applied to project management, a site collection acts as your project portfolio, rolling up information from various projects in one place.
Organizations with multiple business units with different project requirements will typically use a site collection per unit.
As mentioned above, a SharePoint project site inherits properties from the site collection, so it makes sense to have a separate collection for your Marketing, Finance, and IT teams. The various areas of the business can create a site collection and project sites tailored to their processes.
A SharePoint site collection is also useful if you need to share documents or information with external users without granting access to your larger systems. You can simply create and share a site collection with restricted permissions.
Configuring a Project Site in SharePoint
As you can see, SharePoint is a powerful project management tool. However, SharePoint doesn’t look like a project management tool out of the box.

If you decide to use out-of-the-box SharePoint for project management, you will need to build your site to meet your requirements – or ask your IT team to do so.
Creating a SharePoint project site involves a number of steps including:
-
Deciding the site architecture, i.e., where the site will site in your SharePoint environment.
-
Figuring out what lists and web parts you need to add to the site to support your project team.
-
Creating the site.
-
Adding lists and web parts.
-
Configuring each element.
Depending on your SharePoint development skills, configuring a basic SharePoint site for your project is a lengthy process.
Think you can manage the SharePoint side? To make sure the site is optimized, you’ll need to go back a few steps and also think about your project management process.
-
What lists and web parts do you actually need to add to the site?
-
How many fields does each list need?
-
What metadata should you add to the documents library?
-
Do you need issues and risks?
-
How will you one or two columns to present information?
If the project site is not designed correctly, your project is at risk before the work even begins.
That’s where the Free SharePoint Project Management Template from BrightWork will give you a head start.
The Free template has everything you need to initiate, plan, track, and report on a project using SharePoint – straight out-of-the-box.
The project site template includes key lists and web parts –tasks, issues, and a document library – and metric tiles, project status reports, Work reports, and a ‘tasks by status’ chart for quick tracking.
The site is based on a practical, five-step approach to project management with guidance included in the project wiki.
The Free Template works on SharePoint 2019/2016/2013 and SharePoint Online.
Don’t waste any more time planning your SharePoint – use the Free Template instead!
Project Management Templates for Microsoft 365
It’s worth noting that SharePoint has evolved, and there are newer versions available beyond SharePoint 2019 and SharePoint 2016, such as SharePoint Online in Microsoft 365.
In addition to SharePoint Online, Microsoft 365 includes additional features, apps, and improvements that can all be leveraged for their project management capabilities.
If your organization is moving away from on-premise SharePoint but would still like to manage your projects within the Microsoft ecosystem, then Microsoft 365 is a good place to start.
You can use:
-
Power Apps for project sites
-
Power BI for portfolio reporting
-
Power Automate to manage workflows
-
SharePoint Online for document management
-
Microsoft Teams for collaboration
-
Azure Active Directory for security and permissions.
BrightWork 365 is a project and portfolio management solution built on top of Microsoft 365 and the Power Platform. It is designed to enhance and extend the project management capabilities of Microsoft 365, providing additional features and templates for managing projects, tasks, resources, and portfolios.
BrightWork 365 offers preconfigured project management templates that align with popular project management methodologies and provides a user-friendly interface, customizable dashboards, and reporting capabilities to help teams effectively plan, track, and collaborate on projects within the Microsoft 365 environment.