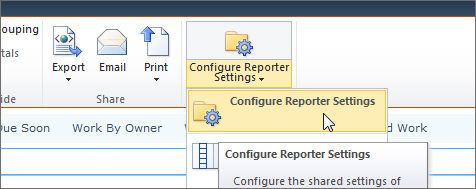
Click on the report you want to configure and click Configure Reporter Settings on the Reporter Tools ribbon.
Select the appropriate options (see below) and click OK.
The Reporter Settings page is where you configure shared report settings not available on the Reporter Tools ribbon. This includes things like the Report Definition; the report scope; data binding; etc.
To change things like the columns in a report, the grouping and sorting, display of totals and create report filters, use the Reporter Tools ribbon. The Reporter Tools ribbon also allows you to create a personal report.
To open the reporter settings page:
Click on the report you want to configure and click Configure Reporter Settings on the Reporter Tools ribbon.
Select the appropriate options (see below) and click OK.
The available options depend on the selected report type:
Chart Reports
These reports render list data in charts (e.g. bar, line, pie) - configure Chart Reports
Gantt report
These reports render list data in a Gantt style - configure Gantt Reports
List Item Reports
These reports renders list data in manner similar to standard SharePoint views - configure List Item Reports
Resource Usage Reports
These reports allow you to report on the amount of work required and/or assigned, spread evenly across the period of time allowed for the work to be completed - configure Resource Usage Reports